census10to20
census10to20.Rmd
library(sdc.census10to20)
library(dplyr)
#>
#> Attaching package: 'dplyr'
#> The following objects are masked from 'package:stats':
#>
#>     filter, lag
#> The following objects are masked from 'package:base':
#>
#>     intersect, setdiff, setequal, union
library(readr)
library(tigris)
#> To enable caching of data, set `options(tigris_use_cache = TRUE)`
#> in your R script or .Rprofile.load data
data(va_hdcttr_vdh_2017_2021_material_deprivation_index,
  package = "sdc.census10to20"
)
data <- dfuse the standardize function
this function produces both standardized and original values (see the measure variable)
standardized_data <- standardize_all(data)
#> Warning in convert_2010_to_2020_bounds(temp): data contains missing or NULL values. the value of any new tract that
#>       overlaps with a NULL value will be coerced to NULL.
#>       If this is an issue, we recommend manual insertion of values based on
#>       your contextual specifications.
#> Warning in convert_2010_to_2020_bounds(temp): data contains missing or NULL values. the value of any new tract that
#>       overlaps with a NULL value will be coerced to NULL.
#>       If this is an issue, we recommend manual insertion of values based on
#>       your contextual specifications.
#> Warning in convert_2010_to_2020_bounds(temp): data contains missing or NULL values. the value of any new tract that
#>       overlaps with a NULL value will be coerced to NULL.
#>       If this is an issue, we recommend manual insertion of values based on
#> your contextual specifications.getting tract shape files for VA
virginia_tracts_2010 <- tracts(state = "51", year = 2010, cb = TRUE)
#> | | | 0% | |== | 3% | |=== | 4% | |==== | 6% | |===== | 7% | |======= | 10% | |========== | 14% | |=========== | 16% | |============ | 17% | |============== | 20% | |================ | 22% | |================= | 24% | |================== | 26% | |=================== | 28% | |===================== | 30% | |======================= | 33% | |======================== | 34% | |========================== | 37% | |============================ | 39% | |============================= | 42% | |=============================== | 45% | |================================== | 49% | |==================================== | 51% | |===================================== | 52% | |======================================= | 55% | |======================================== | 58% | |========================================== | 60% | |=========================================== | 62% | |============================================= | 64% | |=============================================== | 67% | |================================================ | 68% | |================================================== | 71% | |==================================================== | 75% | |===================================================== | 76% | |======================================================= | 79% | |========================================================= | 81% | |=========================================================== | 84% | |============================================================ | 86% | |============================================================= | 87% | |=============================================================== | 90% | |================================================================ | 91% | |================================================================== | 95% | |=================================================================== | 96% | |===================================================================== | 99% | |======================================================================| 100%
virginia_tracts_2020 <- tracts(state = "51", year = 2020, cb = TRUE)
#>   |                                                                              |                                                                      |   0%  |                                                                              |=                                                                     |   2%  |                                                                              |===                                                                   |   4%  |                                                                              |====                                                                  |   5%  |                                                                              |=====                                                                 |   7%  |                                                                              |======                                                                |   9%  |                                                                              |=======                                                               |  10%  |                                                                              |=========                                                             |  12%  |                                                                              |=========                                                             |  13%  |                                                                              |==========                                                            |  15%  |                                                                              |===========                                                           |  16%  |                                                                              |============                                                          |  18%  |                                                                              |=============                                                         |  19%  |                                                                              |==============                                                        |  20%  |                                                                              |===============                                                       |  22%  |                                                                              |=================                                                     |  24%  |                                                                              |==============================================                        |  65%  |                                                                              |=================================================                     |  70%  |                                                                              |===================================================                   |  73%  |                                                                              |=====================================================                 |  75%  |                                                                              |=====================================================                 |  76%  |                                                                              |=======================================================               |  79%  |                                                                              |==========================================================            |  83%  |                                                                              |===========================================================           |  85%  |                                                                              |============================================================          |  86%  |                                                                              |===============================================================       |  90%  |                                                                              |=================================================================     |  93%  |                                                                              |==================================================================    |  95%  |                                                                              |===================================================================   |  96%  |                                                                              |====================================================================  |  97%  |                                                                              |===================================================================== |  99%  |                                                                              |======================================================================| 100%
virginia_tracts_2010$geoid <- substring(virginia_tracts_2010$GEO_ID, 10)
virginia_tracts_2020$geoid <- virginia_tracts_2020$GEOIDmaking standaardized map
my_plot_std <- ggplot(data = standardized_data_std) +
  geom_sf(aes(fill = value)) +
  scale_fill_gradient2(
    low = "white",
    high = "red",
    midpoint = median(standardized_data_std$value, na.rm = TRUE),
    space = "Lab",
    na.value = "grey50",
    limits = c(0, 0.5)
  ) +
  labs(title = 'Townsend Index - Standardized', fill = "Value") +
  theme_minimal()
# ggsave(
#   "standardized.png",
#   plot = my_plot,
#   width = 10,
#   height = 8,
#   dpi = 300
# )
making original map
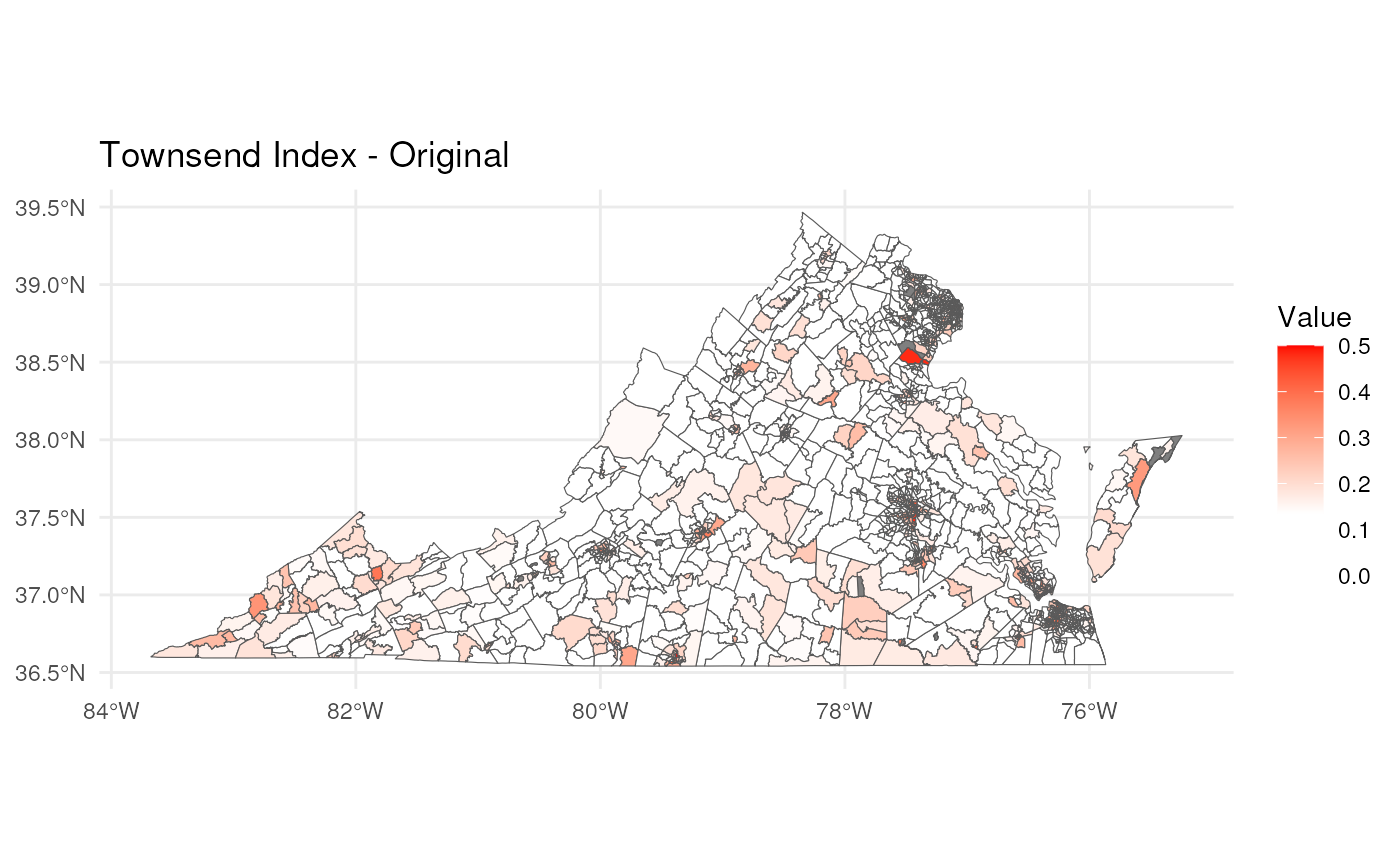
my_plot_org <- ggplot(data = standardized_data_org) +
  geom_sf(aes(fill = value)) +
  scale_fill_gradient2(
    low = "white",
    high = "red",
    midpoint = median(standardized_data_org$value, na.rm = TRUE),
    space = "Lab",
    na.value = "grey50",
    limits = c(0, 0.5)
  ) +
  labs(title = 'Townsend Index - Original', fill = "Value") +
  theme_minimal()
# ggsave(
#   "original.png",
#   plot = my_plot,
#   width = 10,
#   height = 8,
#   dpi = 300
# )
plot(my_plot_org)