This page provides basic descriptions of the key variables used in this study after they were prepared.
Datasets for Residential Parcels
Location: Information on the physical location of the parcel
Characteristics: Information on the physical characteristics of the improvement on residential parcels
Selling: Information on when a property changed ownership
Table of N's per dataset/year
| Dataset | Years | Unit of observation | N | Number of Properties (Characteristics) that are not in dataset |
|---|---|---|---|---|
| Location | 2015 | Property | 29,005 | 0 |
| Characteristics | 2015 | Property | 29,005 | 100% |
| Selling | (Past three sales starting from 2015) | Transaction with an attached selling amount | 10,827 | 72% |
| 2009 | Transaction with an attached selling amount | 1,363 | 96% | |
| 2010 | Transaction with an attached selling amount | 1,496 | 95% | |
| 2011 | Transaction with an attached selling amount |
1,463 |
96% | |
| 2012 | Transaction with an attached selling amount | 1,690 | 95% | |
| 2013 | Transaction with an attached selling amount | 2,004 | 94% | |
| 2014 | Transaction with an attached selling amount | 1,937 | 94% | |
| 2015 | Transaction with an attached selling amount | 874 | 97% |
Data Elements (Click or Scroll Down to See Description)
- Property Type
- Year Built
- Number of Bedrooms
- Presence of a Bathroom
- Heating Fuel
- Selling Amount
- Selling Amount in Constant 2013 Dollars
Note:
The variables mentioned in the data description below that have a suffix of ACS are those data that were recoded to match the categorization that ACS uses.
The box plots presented below have outliers hidden. A box plot is a graphical rendition of statistical data based on the minimum, first quartile, median, third quartile, and maximum.
Property Type
Table: Characteristics
Variable: PCDesc
Number missing: 12
Class: Factor
Frequency Table:
| Multi-Family | Single Family - Suburban | |
|---|---|---|
| 2015 |
101 (0%) |
28,892 (100%) |
Year Built
Table: Characteristics
Variable: YrBuiltACS
Number missing: 0
Class: Factor
Frequency Table:
|
1939 or earlier |
1940 - 1949 |
1950 - 1959 |
1960 - 1969 |
1970 - 1979 |
1980 - 1989 |
1990 - 1999 |
2000 - 2009 |
2010 or later |
|
|---|---|---|---|---|---|---|---|---|---|
| 2015 |
3,225 (11%) |
200 (1%) |
721 (2%) |
1,130 (4%) |
2,354 (8%) |
5,396 (19%) |
5,637 (19%) |
7,963 (14%) |
2,379 (8%) |
Number of Bed Rooms
Table: Characteristics
Variable: BedcountACS
Number missing: 0
Class: Factor
Frequency Table:
| 0 | 1 | 2 | 3 | 4 | 5 or more | |
|---|---|---|---|---|---|---|
| 2015 |
5,227 (18%) |
199 (1%) |
2,490 (9%) |
13,119 (45%) |
6,881 (24%) |
1089 (4%) |
Presence of a Bathroom
Table: Characteristics
Variable: BathACS
Number missing: 0
Class: Factor
Frequency Table:
| With at least one full bath | No full bath | |
|---|---|---|
| 2015 |
25,815 (89%) |
3,190 (11%) |
Heating Fuel
Table: Characteristics
Variable: HeatingACS
Number missing: 4,423 (15%)
Class: Factor
Frequency Table:
|
Electricity |
Fuel oil, kerosene, etc. |
No Fuel Used | Other Fuel | Solar energy | Unknown | Utility gas | |
|---|---|---|---|---|---|---|---|
| 2015 |
34 (0%) |
9 (0%) |
9 (0%) |
150 (1%) |
19 (0%) |
18,067 (73%) |
6,294 (26%) |
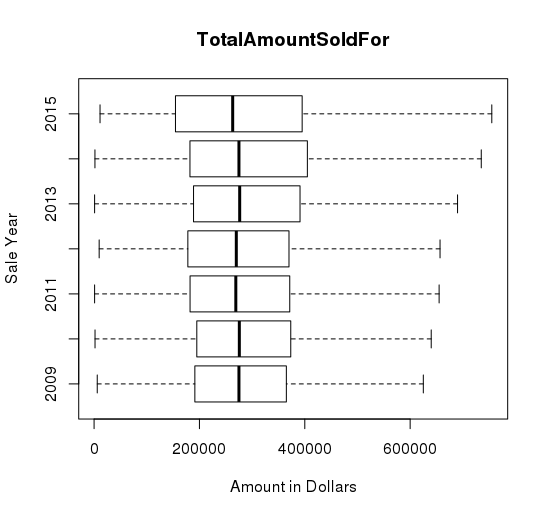
Selling Amount
Table: Sale
Variable: TotalAmountSoldFor
Number missing: 0
Class: Numeric
Range: 1000 – 23,968,397
Standard Deviation: 985,458
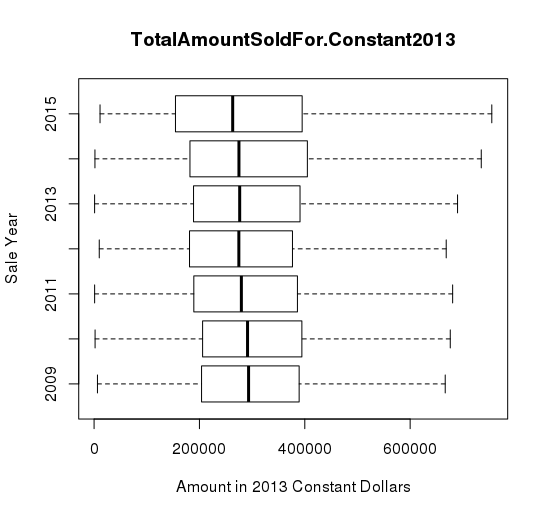
Selling Amount in Constant 2013 Dollars
Table: Sale
Variable: TotalAmountSoldFor.Constant2013
Class: Numeric
Range: 1,000 – 25,322,544
Standard Deviation: 1,037,975