This page provides basic descriptions of the key variables used in this study after they were prepared.
Datasets for Residential Properties with an Improvement (Building)
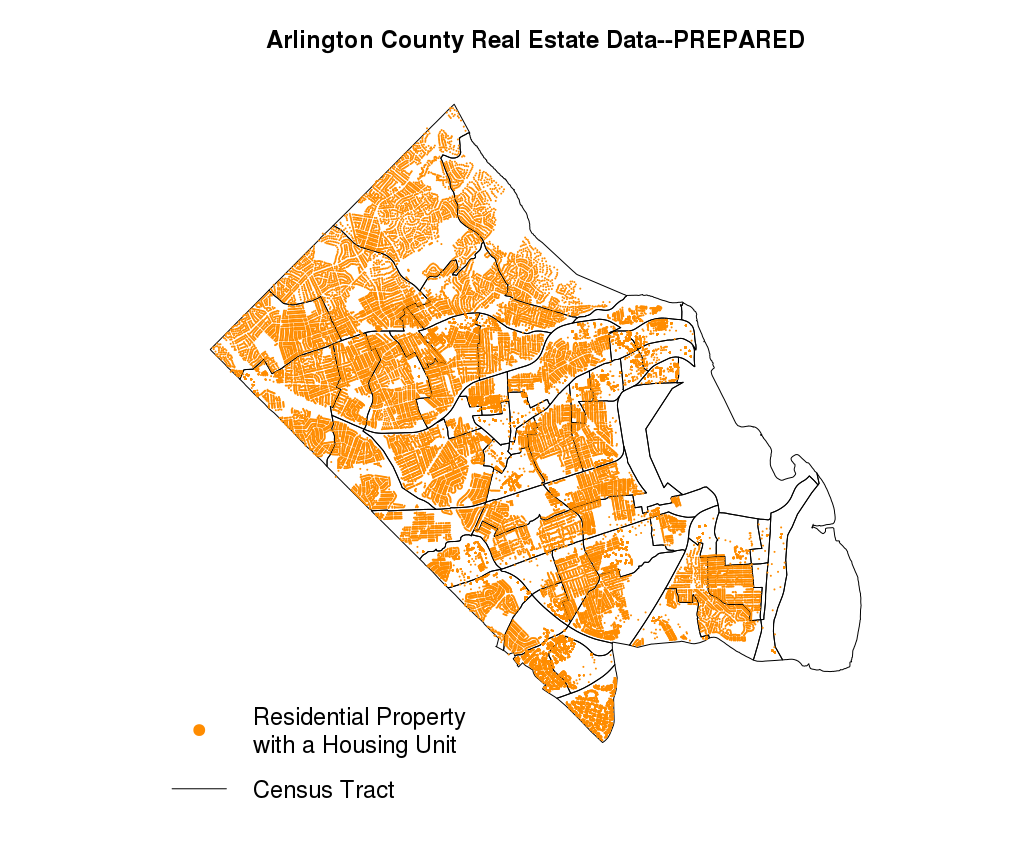
PROPERTY: Information on location and general characteristics of the property
IMPROVEMENT DWELLING: Information on the dwelling
INTERIOR IMPROVEMENT DWELLING: Information on the interior of the dwelling
ASSESSMENTS: Information on the assessment per a property
REAL ESTATE ASSESSMENT PAYMENT HISTORY: Information on the annual taxes per a property
SELLING: Information on when a property changed ownership with some value attached.
Property:
| Year | N | Weighted N | Unit of Observation |
|---|---|---|---|
| 2009 |
60,261 |
100,991 |
Residential Property with a housing unit |
| 2010 |
60,203 |
101,867 |
Residential Property with a housing unit |
| 2011 |
60,465 |
102,299 |
Residential Property with a housing unit |
| 2012 |
60,688 |
102, 511 |
Residential Property with a housing unit |
| 2013 |
60,966 |
103,987 |
Residential Property with a housing unit |
| 2015 | 60,831 | 111,822 | Residential Property with a housing unit |
Improvement Dwelling:
| Year | N | Weighted N | Unit of Observation | Number of properties not in Properties Dataset | Number of properties in Properties Dataset missing |
|---|---|---|---|---|---|
|
2009 |
59,608 | 59,880 | Dwelling | 0 | 728 |
| 2010 | 59,175 | 59,445 | Dwelling | 0 | 1,103 |
| 2011 | 59,236 | 59,507 | Dwelling | 0 | 1,304 |
| 2012 | 59,304 | 59,582 | Dwelling | 0 | 1 1,459 |
| 2013 | 59,440 | 60,123 | Dwelling | 0 | 1, 601 |
| 2015 | 60,187 | 62,905 | Dwelling | 0 | 733 |
Improvement Interior Dwelling:
| Year | N | Weighted N | Unit of Observation | Number of properties not in Properties Dataset | Number of properties in Properties Dataset missing |
|---|---|---|---|---|---|
|
2009 |
59,558 | 59,880 | Dwelling | 0 | 728 |
| 2010 | 59,493 | 59,817 | Dwelling | 0 | 745 |
| 2011 | 59,764 | 60,112 | Dwelling | 0 | 748 |
| 2012 | 59,983 | 60,329 | Dwelling | 0 | 761 |
| 2013 | 60,268 | 60,589 | Dwelling | 0 | 768 |
| 2015 | 600,186 | 62,904 | Dwelling | 0 | 73 |
Assessment (Data CDs):
| Year | N | Unit of Observation | Number of properties not in Properties Dataset | Number of properties in Properties Dataset missing |
|---|---|---|---|---|
| 2009 | 58,889 | Year Assessment-Property | 0 | 770 |
|
2010 |
59,295 | Year Assessment-Property | 0 |
294 |
| 2011 | 59,595 | Year Assessment-Property | 0 |
257 |
| 2012 | 59,744 | Year Assessment-Property | 0 | 336 |
| 2013 | 59,909 | Year Assessment-Property | 0 | 420 |
Assessment (API):
| Year | N | Unit of Observation | Number of properties not in Properties Dataset | Number of properties in Properties Dataset missing |
|---|---|---|---|---|
| 2009 | 13,648 | Year Assessment-Property | 0 | 46,416 |
|
2010 |
44,487 | Year Assessment-Property | 0 |
15,194 |
| 2011 | 47,246 | Year Assessment-Property | 0 |
12,749 |
| 2012 | 48,655 | Year Assessment-Property | 0 | 11,497 |
| 2013 | 45,282 | Year Assessment-Property | 0 | 15,190 |
| 2015 | 48,579 | Year Assessment-Property | 0 | 11,711 |
Real Estate Assessment Payment History:
| Year | N | Unit of Observation | Number of properties not in Properties Dataset | Number of properties in Properties Dataset missing |
|---|---|---|---|---|
| 2009 | 13,466 | Year-Property | 0 | 46,600 |
|
2010 |
43,297 | Year-Property | 0 |
16,396 |
| 2011 | 45,799 | Year-Property | 0 |
14,211 |
| 2012 | 47,203 | Year-Property | 0 | 12,962 |
| 2013 | 44,059 | Year-Property | 0 | 16,427 |
** 2015 not included as there are payments have not been made for the levies.
Selling:
| Year | N | Unit of Observation | Number of properties not in Properties Dataset |
|---|---|---|---|
| 2009 | 3,371 | Market Value Transaction of non Multifamily residential | 0 |
|
2010 |
3,126 | Market Value Transaction of non Multifamily residential | 0 |
| 2011 | 2,709 | Market Value Transaction of non Multifamily residential | 0 |
| 2012 | 3,048 | Market Value Transaction of non Multifamily residential | 0 |
| 2013 | 3,197 | Market Value Transaction of non Multifamily residential | 0 |
| 2015 | 1,291 | Market Value Transaction of non Multifamily residential | 0 |
AC Real Estate and PUMS data
Is the PUMS data different than the AC Real Estate data?
Note: The Null hypothesis with these chi-square tests is that the observed (PUMS) values are not different than the expected (AC).
Result: The PUMS do appear to be different than the AC Real Estate Data .
Bedrooms
|
Year
|
X2 |
DF
|
p-value
|
|---|---|---|---|
| 2013 | 26.22 | 5 | <0.000 |
Year Built
|
Year
|
X2 |
DF
|
p-value
|
|---|---|---|---|
| 2013 | 1,483.5 | 8 | <0.000 |
AC Real Estate and ACS data
Is the the ACS data different than the ACS Real Estate?
Note: The Null hypothesis with these chi-square tests is that the observed (ACS) values are not different than the expected (AC).
Result: The AC and the ACS data do seem to come from the same population
Bedrooms
|
Year
|
X2 |
DF
|
p-value
|
|---|---|---|---|
| 2013 | 30 | 5 | .224 |
Year Built
|
Year
|
X2 |
DF
|
p-value
|
|---|---|---|---|
| 2013 | 72 | 8 | .230 |
Data Elements (Click or Scroll Down to see Description)
- Property Type
-
Number of Units in Building
- Year Built
- Number of Bedrooms
- Presence of a Bathroom
- Heating Fuel
- Assessment Amount (Data CDs)
- Assessment Amount in Constant 2013 Dollars (Data CDs)
- Assessment Amount (API)
- Assessment Amount in Constant 2013 Dollars (API)
- Taxes Paid
-
Taxes Paid in Constant 2013 Dollars
- Taxes Levied
- Taxes Levied in Constant 2013 Dollars
- Selling Amount
- Selling Amount in Constant 2013 Dollars
Note:
The variables mentioned in the data description below that have a suffix of ACS are those data that were recoded to match the categorization that ACS uses.
The box plots presented below have outliers hidden. A box plot is a graphical rendition of statistical data based on the minimum, first quartile, median, third quartile, and maximum.
Property Type
Data Set: Property
Variable: PropertyTypeACS
Population: Residential properties with a building
Weights: Values were weighted base on number of units
Class: Factor
Frequency Table:
|
Weighted N |
Missing |
Condo |
MultiFamily |
Single Family-Attached |
Single Family Detached |
Unknown Affordable Dwelling Unit |
||
|---|---|---|---|---|---|---|---|---|
| 2009 | 100,991 | 0 | 26,288 | 41,166 | 6,312 | 27,145 | 80 | |
| 2010 | 101,867 | 0 | 26,035 | 42,115 | 6,393 | 27,232 | 92 | |
| 2011 | 102,299 | 0 | 26,054 | 42,264 | 6,470 | 27,419 | 92 | |
| 2012 | 102,511 | 0 | 26,183 | 42,268 | 6,512 | 27,460 | 88 | |
| 2013 | 103,987 | 0 | 26,231 | 43,496 | 6,563 | 27,518 | 89 | |
| 2015 | 111,822 | 0 |
26,375 |
49,014 |
6,352 |
27,277 |
2,804 |
Number of Units in Building
Data Set: Property
Variable: NumberofUnitsACS
Population: Residential properties with a building
Weights: Values were weighted base on number of units
Class: Factor
Frequency Table:
|
Weighted N |
Missing |
1-Attached |
1-Detached |
2 Units |
3 or 4 units |
5 to 9 units |
10 to 19 units |
20 to 49 units |
50 or more Units | Unknown | ||
|---|---|---|---|---|---|---|---|---|---|---|---|---|
| 2009 | 100,991 | 0 | 5,7702 | 27,145 | 540 | 79 | 1,108 | 2,066 | 5,340 | 58,735 | 206 | |
| 2010 | 101,867 | 0 | 5,858 | 27,232 | 544 | 91 | 1,101 | 2,031 | 5,336 | 59,441 | 233 | |
| 2011 | 102,229 | 0 | 5,934 | 27,419 | 5402 | 91 | 1,101 | 2,016 |
5,359 |
59,600 | 237 | |
| 2012 | 102,511 | 0 | 5,976 | 27,460 | 238 | 91 | 1,100 | 2,017 | 5,345 | 59,736 | 248 | |
| 2013 | 103,987 | 0 | 6,024 | 27,518 | 542 | 12 | 334 | 1,220 |
4,635 |
63,239 | 463 | |
| 2015 | 111,822 | 0 |
6,356 |
27,276 |
558 |
12 |
283 |
1,163 |
4,503 |
71,810 | 419 |
Year Built
Dataset: Property
Variable: YearBuiltACS (Combination of property and dwelling year built)
Population: Residential properties with a building
Weights: Values were weighted base on number of units
Class: Factor
Frequency Table:
| Weighted N | Missing |
1939 or earlier |
1940 - 1949 |
1950 - 1959 |
1960 - 1969 |
1970 - 1979 |
1980 - 1989 |
1990 - 1999 |
2000 - 2009 |
2010 or later |
||
|---|---|---|---|---|---|---|---|---|---|---|---|---|
| 2009 | 99,595 | 1,396 | 9,559 | 20,440 | 17,084 | 15,993 | 4,122 | 11,899 | 7,375 | 13,123 | --- | |
| 2010 | 101,025 | 842 | 9,606 | 20,421 | 17,061 | 16,151 | 4,125 | 11,988 | 7,372 | 14,281 | 20 | |
| 2011 | 101,427 | 844 | 9,572 | 20,430 | 17,082 | 16,170 | 4,126 | 11,904 | 7,375 | 14,566 | 212 | |
| 2012 | 101,462 | 780 | 9,599 | 20,286 | 16,925 | 15,929 | 4,124 | 11,897 | 7,374 | 14,593 | 735 | |
| 2013 | 97,365 | 6,622 | 9,495 | 18,267 | 16,403 | 13,560 | 4,112 | 11,726 | 6,015 | 15,952 | 1,835 | |
| 2015 | 106,076 |
5,746 |
9,081 |
17,478 |
16,297 |
15,680 |
4,096 |
11,470 |
7,360 |
18,692 |
5,952 |
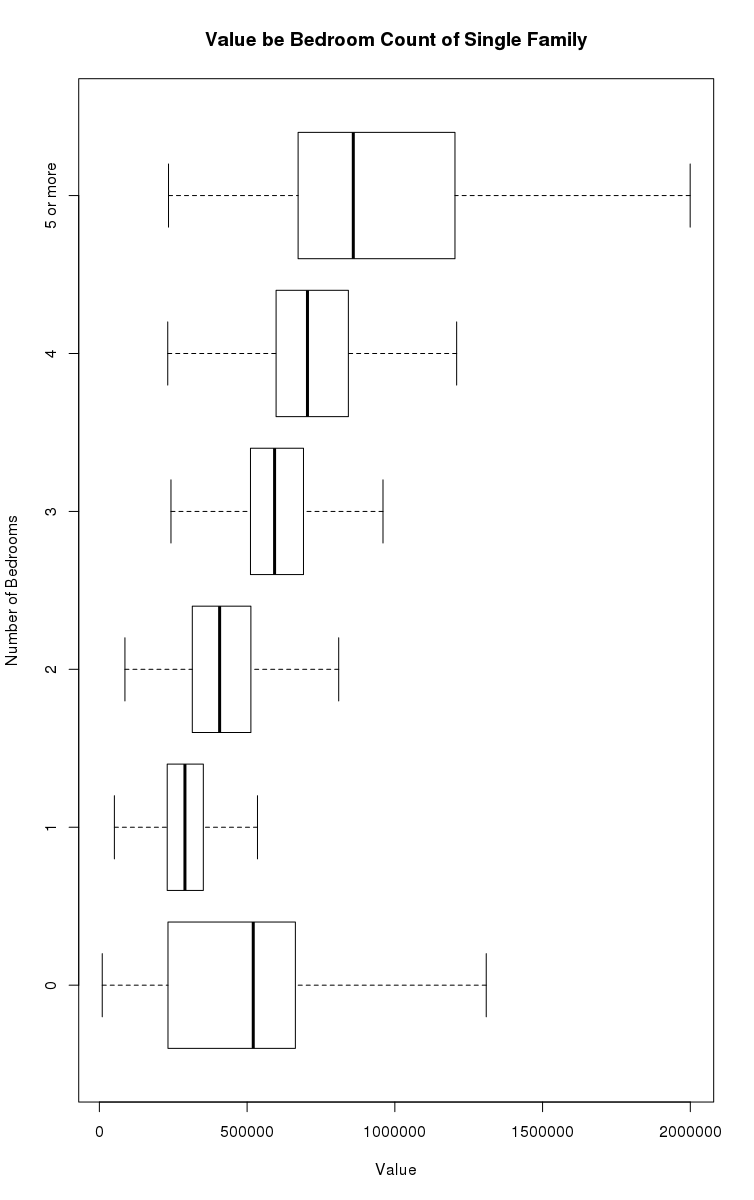
Number of Bedrooms
Dataset: InteriorDwellingImrpovement
Variable: BedCountACS
Population: Residential Dwellings with a building
Weights: Values were weighted base on number of units
Class: Factor
Frequency Table:
Weighted N |
Missing |
0 | 1 | 2 | 3 | 4 | 5 or more | ||
|---|---|---|---|---|---|---|---|---|---|
| 2009 | 59 880 | 0 | 8,841 | 10,704 | 17,167 | 15,428 | 5,481 | 2,259 | |
| 2010 | 59,817 | 0 | 8,079 | 11,006 | 17,230 | 15,504 | 5,501 | 2,497 | |
| 2011 | 60,112 | 0 | 7,807 | 10,967 | 17,195 | 15,748 | 5,712 | 2,683 | |
| 2012 | 60,329 | 0 | 7,545 | 10,946 | 17,180 | 15,801 | 5,970 | 2,887 | |
| 2013 | 60,589 | 0 | 7,343 | 10,943 | 17,093 | 15,798 | 6,280 | 3,132 | |
| 2015 | 62,904 | 0 | 6,408 | 12,022 | 18,752 | 15,475 | 6,699 |
3,548 |
Yet, not all parcels with 0 bedrooms listed are fully accurate. This becomes apparent when looking at the accessed values for 0-bedrooms.
Presence of a Bathroom
Dataset: InteriorDwellingImrpovement
Variable: BathACS
Population: Residential Dwellings with a building
Weights: Values were weighted base on number of units
Class: Factor
Frequency Table:
|
Weighted N |
Missing |
With at least 1 Full Bath | No Full Bath | ||
|---|---|---|---|---|---|
| 2009 | 59,880 | 0 | 58,788 | 1,092 | |
| 2010 | 59,817 | 0 | 59,209 | 608 | |
| 2011 | 60,112 | 0 | 59,542 | 570 | |
| 2012 | 60,329 | 0 | 59,681 | 648 | |
| 2013 | 60,589 | 0 | 59,862 | 727 | |
| 2015 | 62,904 | 0 | 54,443 | 8,461 |
Heating Fuel
Dataset: DwellingImrpovement
Variable: HeatingACS
Population: Residential Dwellings with a building
Weights: Values were weighted base on number of units
Class: Factor
Frequency Table:
| Weighted N | Missing |
Electricity |
Fuel oil, kerosene, etc. |
No Fuel Used | Other Fuel | Solar energy | Unknown | Utility gas | Wood | ||
|---|---|---|---|---|---|---|---|---|---|---|---|
| 2009 | 32,565 | 27,315 | 70 | 5 | 1 | 5 | 1 | 31,723 | 759 | 1 | |
| 2010 | 32,675 | 26,773 | 72 | 5 | 1 | 5 | 1 | 31,823 | 764 | 1 | |
| 2011 | 32,736 | 26,771 | 71 | 5 | 1 | 5 | 1 | 31,885 | 767 | 1 | |
| 2012 | 32,756 | 26,826 | 71 | 5 | 1 | 5 | 1 | 31,906 | 766 | 1 | |
| 2013 | 32,805 | 27,318 | 71 | 5 | 1 | 5 | 1 | 31,952 | 769 | 1 | |
| 2015 | 62,883 | 22 | 179 |
6 |
3 | 9 | 1 | 52,229 | 10,455 | 1 |
Assessment Amount (DATA CD)
Dataset: Data CD Assessments
Variable: Totl
Years: 2009-2013
Population: Residential properties with a building that had an assessment conducted
Exclusion: Removed those classified as multifamily and unknown affordable dwelling. (Renters do not get asked real estate tax questions)
N: See Assessment (CD) Table above
Number missing: 0
Class: Numeric
Range: 9,700 — 33,886,900
Standard Deviation: 346,078
Assessment Amount in Constant 2013 Dollars (DATA CD)
Dataset: Data CD Assessments
Variable: Totl2013
Years: 2009-2013
Population: Residential properties with a building that had an assessment conducted
Exclusion: Removed those classified as multifamily and unknown affordable dwelling. (Renters do not get asked real estate tax questions)
N: See Assessment (CD) Table above
Number missing: 0
Class: Numeric
Range: 9,700 — 35,215,593
Standard Deviation: 358,405.7
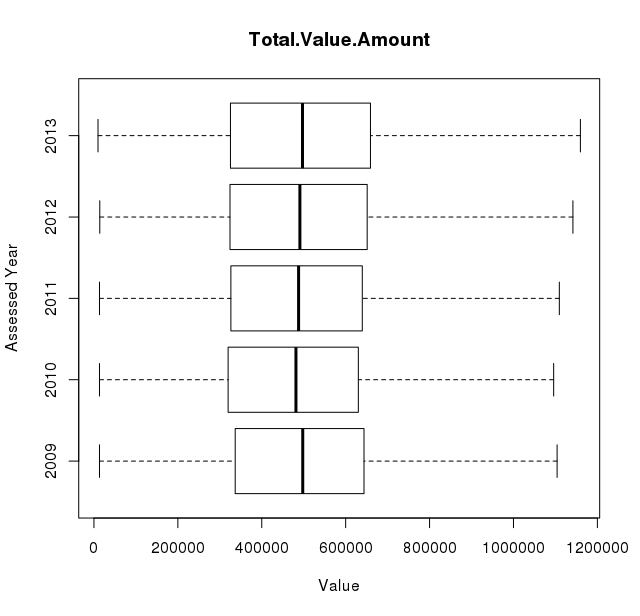
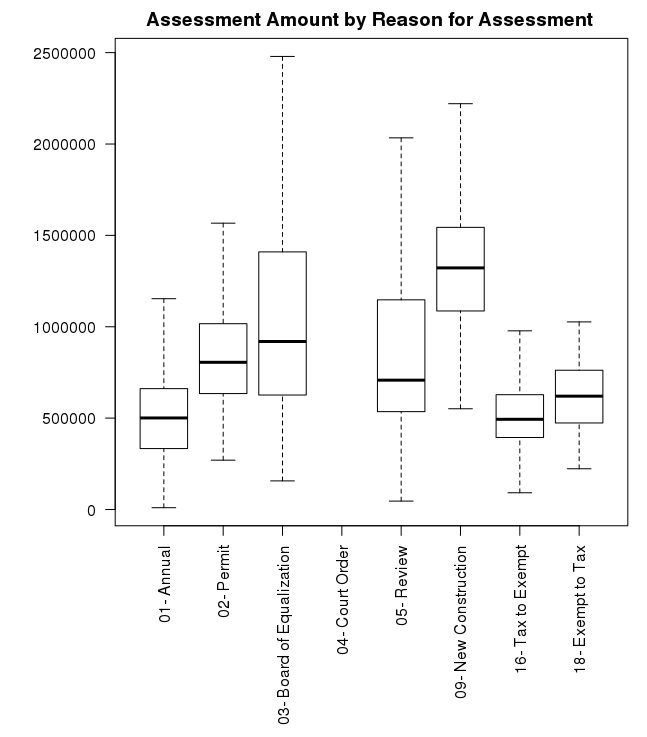
Assessment Amount
Dataset: API Assessments
Variable: Total.Value.Amount
Years: 2009-2015
Population: Residential properties with a building that had an assessment conducted
Exclusion: Removed those classified as multifamily and unknown affordable dwelling. (Renters do not get asked real estate tax questions)
N: See Assessment (API) Table above
Number missing: 0
Class: Numeric
Range: 9,700 — 33,886,900
Standard Deviation: 341,747.5
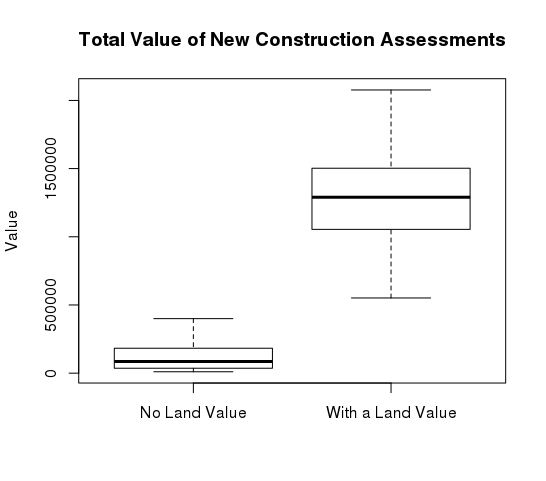
There were 538 Assessments classified under "New Construction." Of these, 546 have no land value associated with them (Even if there were land values in the previous and following years. " I n 2012 the procedure changed so anything before you will see the new construction amount posted with no land value. Technically, land can not change in the middle of the year only at reassessment so previous they chose not to post the land value." At the same time, the improvement value for these observations are significantly lower than the improvement value the following year. Cannot remove as unsure if these are occupied housing. Instead, the land value for the following year was brought back to replace the 0 Land Value and a new total created.
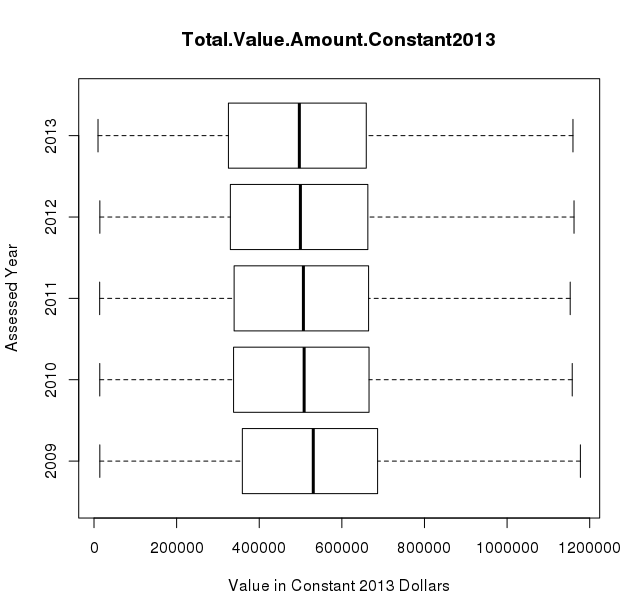
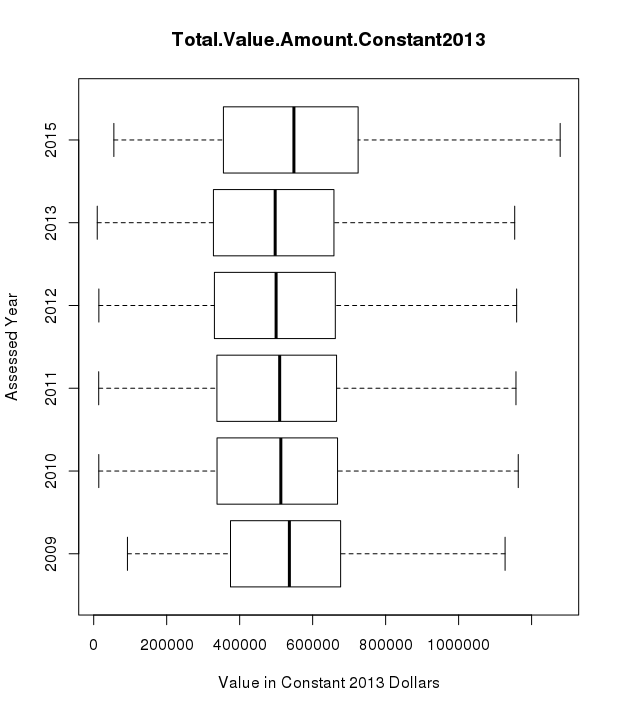
Assessment Amount in Constant 2013 Dollars
Dataset: API Assessments
Variable: Total.Value.Amount.Constant2013
Years: 2009-2015
Population: Residential properties with a building that had an assessment conducted
Exclusion: Removed those classified as multifamily and unknown affordable dwelling. (Renters do not get asked real estate tax questions)
N: See Assessment (API) Table above
Number missing: 0
Class: Numeric
Range: 6700 — 34,491,474
Standard Deviation: 357,555.6
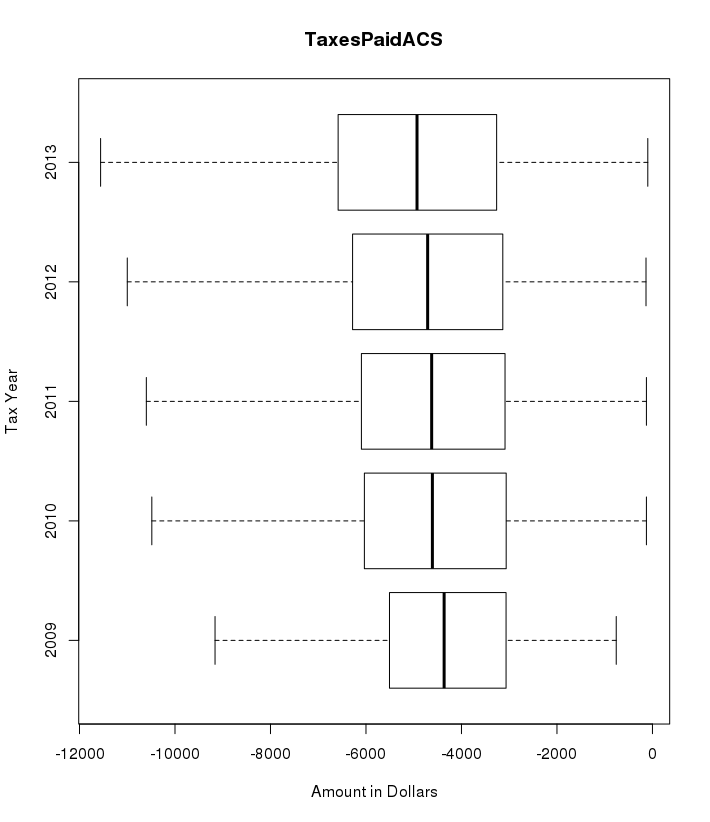
Taxes Paid
Dataset: Payment History
Variable: TaxesPaidACS
Years: 2009-2014
Population: Residential properties with a building that had an assessment conducted during the year
Exclusion: Removed those classified as multifamily and unknown affordable dwelling. (Renters do not get asked real estate tax questions)
N: See Real Estate Assessment Payment History Table above
Number missing: 2,983
Class: Numeric
Range: --309,015.32 — -97.58
Standard Deviation: 3107.71
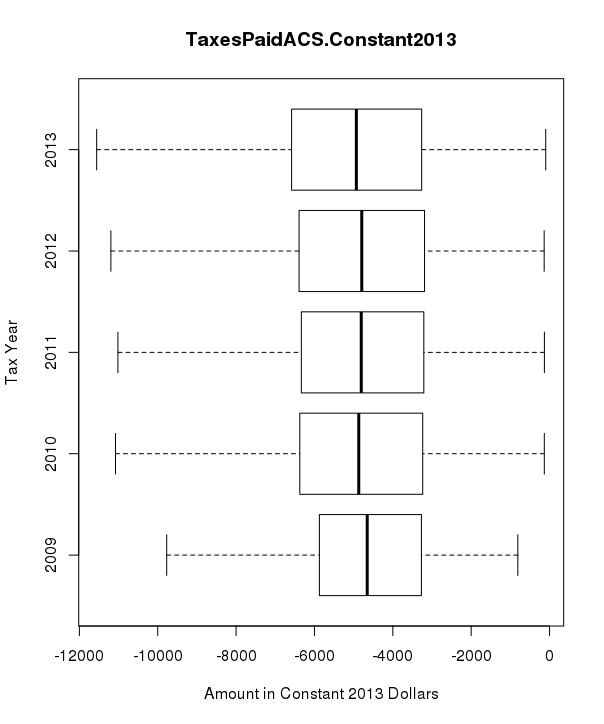
Taxes Paid in Constant 2013 dollars
Dataset: Payment History
Variable: TaxesPaidACS.Constant2013
Years: 2009-2014
Population: Residential properties with a building that had an assessment conducted during the year
Exclusion: Removed those classified as multifamily and unknown affordable dwelling. (Renters do not get asked real estate tax questions)
N: See Real Estate Assessment Payment History Table above
Number missing: 2,983
Class: Numeric
Range: -326,473.81 — -97358
Standard Deviation: 3,190.20
Taxes Levied
Dataset: Payment History
Variable: TaxesLeviedACS
Years: 2009-2014
Population: Residential properties with a building that had an assessment conducted during the year
Exclusion: Removed those classified as multifamily and unknown affordable dwelling. (Renters do not get asked real estate tax questions)
N: See Real Estate Assessment Payment History Table above
Number missing: 64
Class: Numeric
Range: 97.58 – 329,041.78
Standard Deviation: 3,135.57
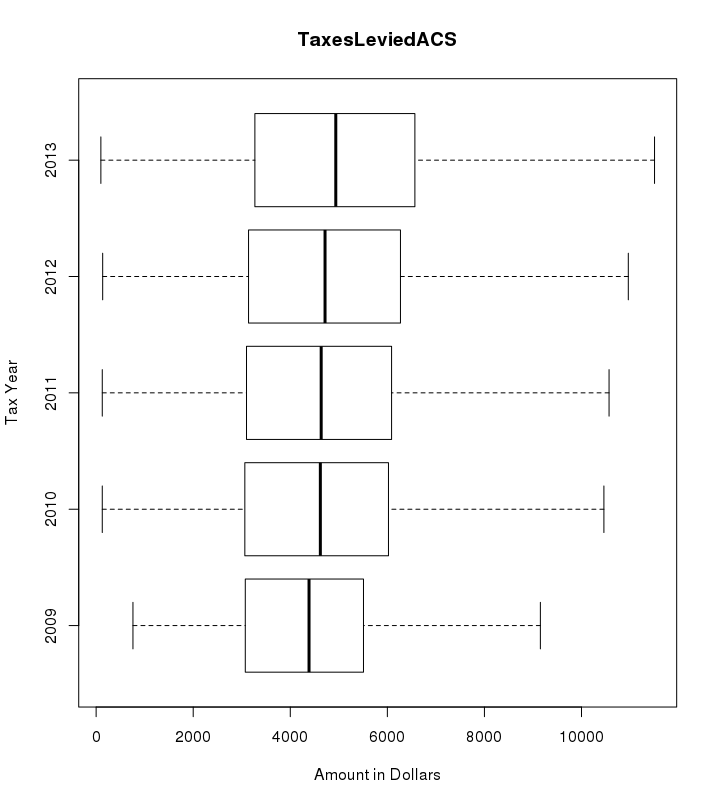
** 2% of payments do no not mach the amount levied
Taxes Levied in Constant 2013 Dollars
Dataset: Payment History
Variable: TaxesLeviedACS.Constant2013
Years: 2009-2014
Population: Residential properties with a building that had an assessment conducted during the year
Exclusion: Removed those classified as multifamily and unknown affordable dwelling. (Renters do not get asked real estate tax questions)
N: See Real Estate Assessment Payment History Table above
Number missing: 64
Class: Numeric
Range: 97.58 – 334,912.20
Standard Deviation: 37,785.96
Selling Amount
Dataset: Sale
Variable: saleAmt
Year: 2009-2015
Population: Residential properties with a building that had an assessment conducted during the year
Exclusion:
- Removed those classified as multifamily and unknown affordable dwelling. (Renters do not get asked value question);
-
Removed those that were not market value
N: See Real Estate Assessment Payment History Table above
Number missing: 0
Class: Numeric
Range: 10,000 — 16,000,000
Standard Deviation: 382,123.8
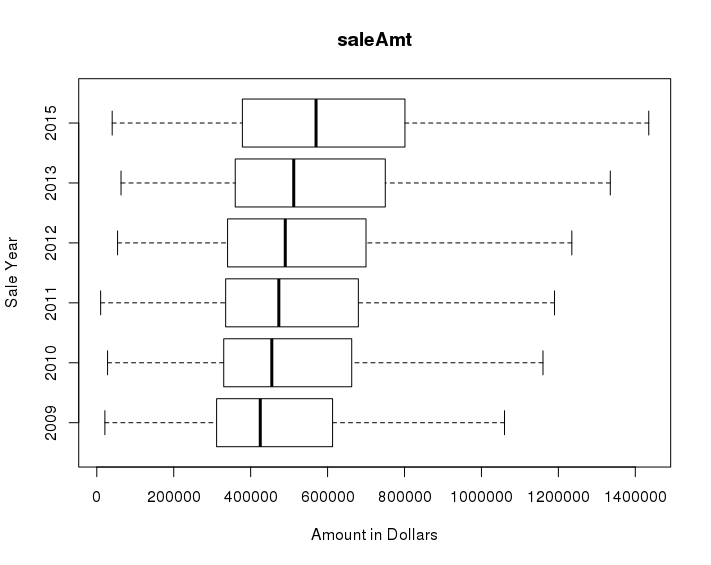
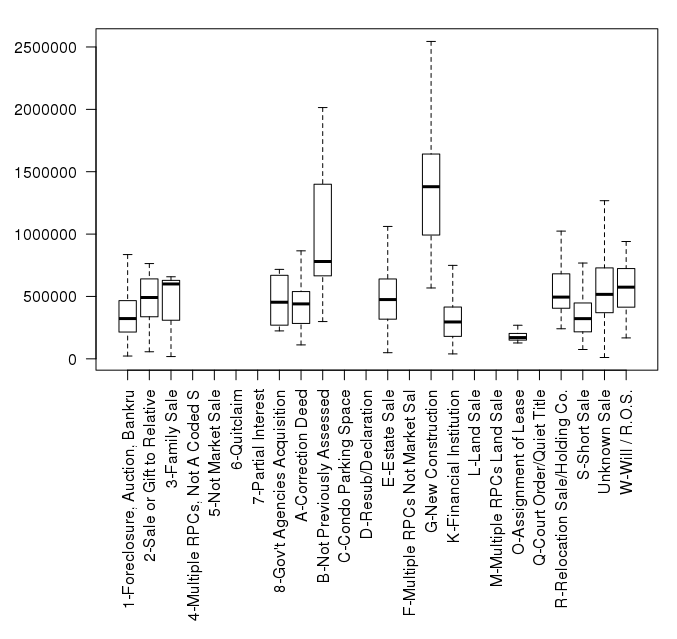
Table of sale types:
|
1-Foreclosure, Auction, Bankru |
2-Sale or Gift to Relative |
3-Family Sale |
8-Gov't Agencies Acquisition |
A-Correction Deed |
B-Not Previously Assessed |
E-Estate Sale |
|---|---|---|---|---|---|---|
|
773 |
3,202 |
147 |
10 |
2,182 |
102 |
445 |
|
G-New Construction |
K-Financial Institution |
O-Assignment of Lease |
R-Relocation Sale/Holding Co. |
S-Short Sale |
Unknown Sale |
W-Will / R.O.S. |
|
132 |
645 |
111 |
105 |
267 |
14,159 |
1,635 |