T his page provides basic descriptions of the key variables used in this study after they were prepared.
Datasets for Residential Properties with an Improvement (Building)
LOCATION: Information on location the property
HOUSING: Information on the physical characteristics of the house at the time of the selling
SELLING: Information on when a property was sold
Location:
| Year | N | Unit of Observation |
|---|---|---|
| 2010-2013 |
4,350 |
Property |
Note: The data had incomplete parcel numbers. As such, this is an estimate of the number of properties based and the Address+Legal Description. This number assumes that the address is the same when a property appear more than once.
Housing:
| Year | N | Unit of Observation |
|---|---|---|
| 2009 | 783 | Year-Property |
|
2010 |
758 | Year-Property |
| 2011 | 758 | Year-Property |
| 2012 | 936 | Year-Property |
| 2013 | 1,146 | Year-Property |
Selling:
| Year | N | Unit of Observation |
|---|---|---|
| 2009 | 783 | Transaction |
|
2010 |
758 | Transaction |
| 2011 | 758 | Transaction |
| 2012 | 936 | Transaction |
| 2013 | 1,144 | Transaction |
Original Data unit of observation was a MLS transaction where a house sold. The table below shows the frequency that a single property appears (i.e. a property that appears twice was sold 2 times between 2010 and 2013)
| Once | Two |
|---|---|
|
4321 |
29 |
Data Elements (Click or Scroll Down to see Description)
- Property Type
- Year Built
- Number of Bedrooms
- Presence of a Bathroom
- Original List Price
- Original List Price in Constant 2013 Dollars
- Closing Price
- Closing Price in Constant 2013 Dollars
Note:
The variables mentioned in the data description below that have a suffix of ACS are those data that were recoded to match the categorization that ACS uses.
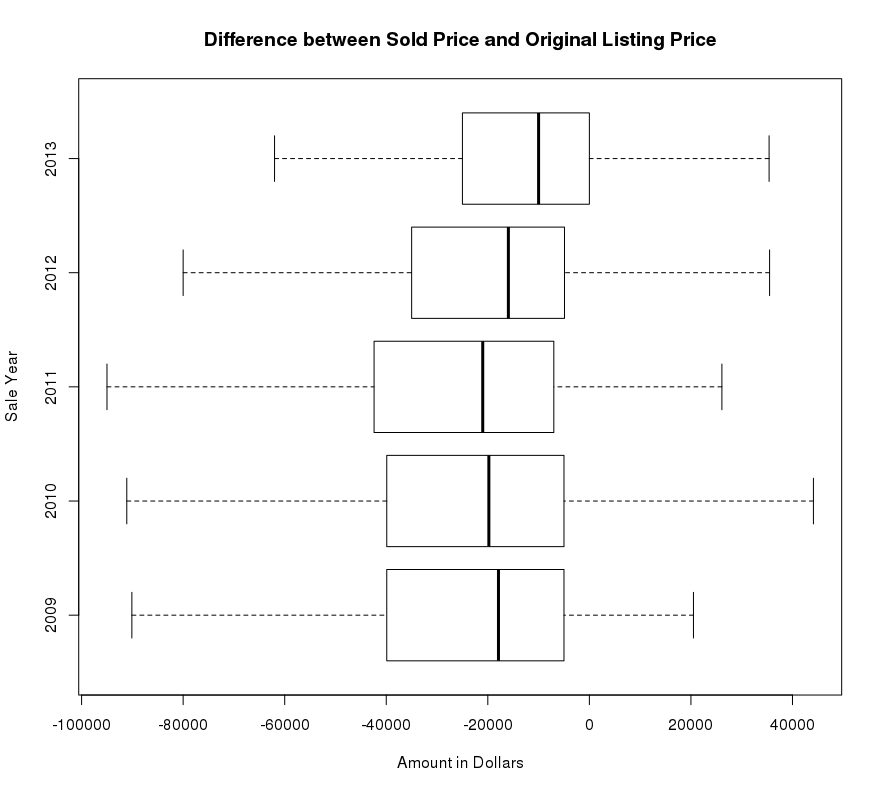
The box plots presented below have outliers hidden. A box plot is a graphical rendition of statistical data based on the minimum, first quartile, median, third quartile, and maximum.
Property Type
Data Set: Housing
Variable: Type/Ownership
Population: Residential properties that were sold on the housing market
Class: Factor
Frequency:
| Year | N | Missing | Mobile home |
Condo |
Single Family-Attached |
Single Family-Detached | |
|---|---|---|---|---|---|---|---|
| 2009 | 783 |
0 |
0 | 68 | 143 | 572 | |
| 2010 | 758 | 0 | 1 | 59 | 110 | 588 | |
| 2011 | 758 |
0 |
0 | 66 | 101 | 591 | |
| 2012 | 936 | 0 | 0 | 99 | 140 | 697 | |
| 2013 | 1,144 | 0 | 1 | 139 | 186 | 818 |
Year Built
Data Set: Housing
Variable: YearBuiltACS
Population: Residential properties that were sold on the housing market
Class: Factor
Frequency:
| Year | N | Missing |
1939 or earlier |
1940 - 1949 |
1950 - 1959 |
1960 - 1969 |
1970 - 1979 |
1980 - 1989 |
1990 - 1999 |
2000 - 2009 |
2010 or later |
|
|---|---|---|---|---|---|---|---|---|---|---|---|---|
| 2009 | 783 | 0 | 3 | 3 | 11 | 19 | 55 | 126 | 161 | 405 | 0 | |
| 2010 | 758 | 0 | 2 | 3 | 9 | 16 | 49 | 137 | 166 | 285 | 91 | |
| 2011 | 758 | 0 | 3 | 3 | 9 | 21 | 48 | 136 | 155 | 248 | 135 | |
| 2012 | 936 | 0 | 4 | 3 | 13 | 19 | 53 | 139 | 205 | 335 | 165 | |
| 2013 | 1,144 | 0 | 4 | 4 | 18 | 19 | 55 | 186 | 226 | 361 | 271 |
0
Number of Bedrooms
Data Set: Housing
Variable: BedsACS
Population: Residential properties that were sold on the housing market
Class: Factor
Frequency:
| Year | N | Missing | 0 | 1 | 2 | 3 | 4 | 5 or more | |
|---|---|---|---|---|---|---|---|---|---|
| 2009 | 783 | 0 | 0 | 6 | 99 | 369 | 262 | 47 | |
| 2010 | 758 | 0 | 0 | 2 | 75 | 366 | 263 | 52 | |
| 2011 | 758 | 0 | 0 | 6 | 84 | 359 | 252 | 57 | |
| 2012 | 936 | 0 | 0 | 8 | 112 | 412 | 340 | 64 | |
| 2013 | 1,144 | 0 | 0 | 4 | 135 | 506 | 412 | 87 |
Presence of a Bathroom
Data Set: Housing
Variable: BathsACS
Population: Residential properties that were sold on the housing market
Class: Factor
Frequency:
| Year | N | Missing | With at least 1 Full Bath | No Full Bath | |
|---|---|---|---|---|---|
| 2009 | 783 | 0 | 783 | 0 | |
| 2010 | 758 | 0 | 758 | 0 | |
| 2011 | 758 | 0 | 758 | 0 | |
| 2012 | 936 | 0 | 935 | 1 | |
| 2013 | 1,144 | 0 | 1,144 | 0 |
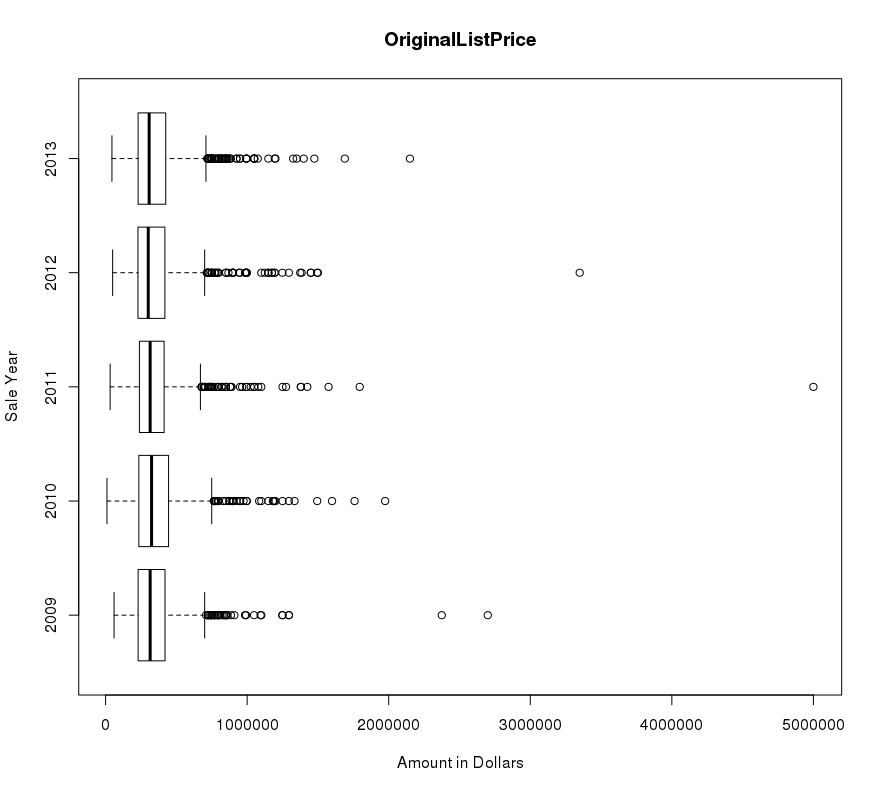
Original List Price
Data Set: Selling
Variable: Orig..List.Price
Population: A housing transaction that sold on the housing market
Class: Numeric
N: See Selling Table Description at top of page
Missing: 1
Range: 10,000 - 5,000,000
SD: 219,55.5
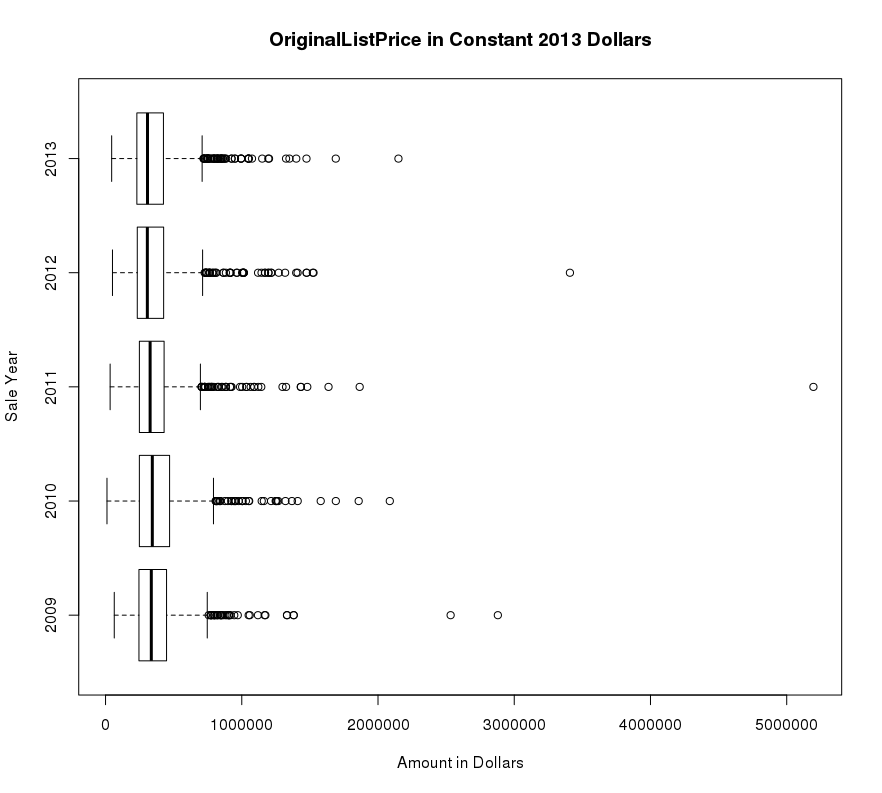
Original List Price in Constant 2013 Dollars
Data Set: Selling
Variable: OriginalListPrice.Constant2013
Population: A housing transaction that sold on the housing market
Class: Numeric
N: See Selling Table Description at top of page
Missing: 1
Range: 10,564.97 - 5,196,048.16
SD: 226,848.1
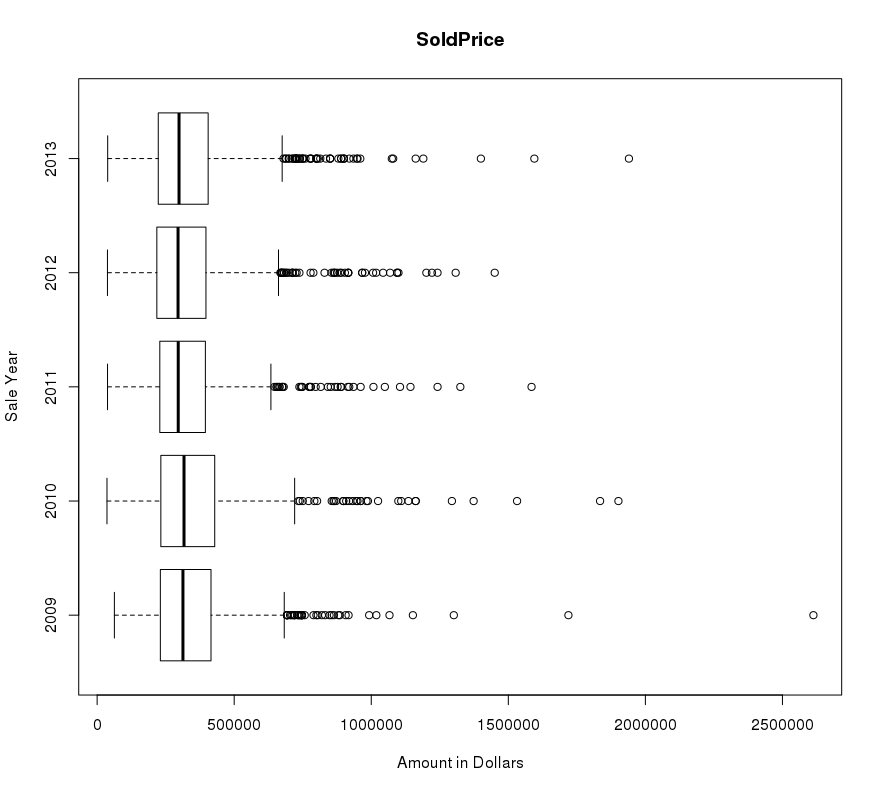
Sold Price
Data Set: Selling
Variable: Sold.Price
Population: A housing transaction that sold on the housing market
Class: Numeric
N: See Selling Table Description at top of page
Missing: 0
Range: 34,000 - 2,450,000
SD: 176,962.7
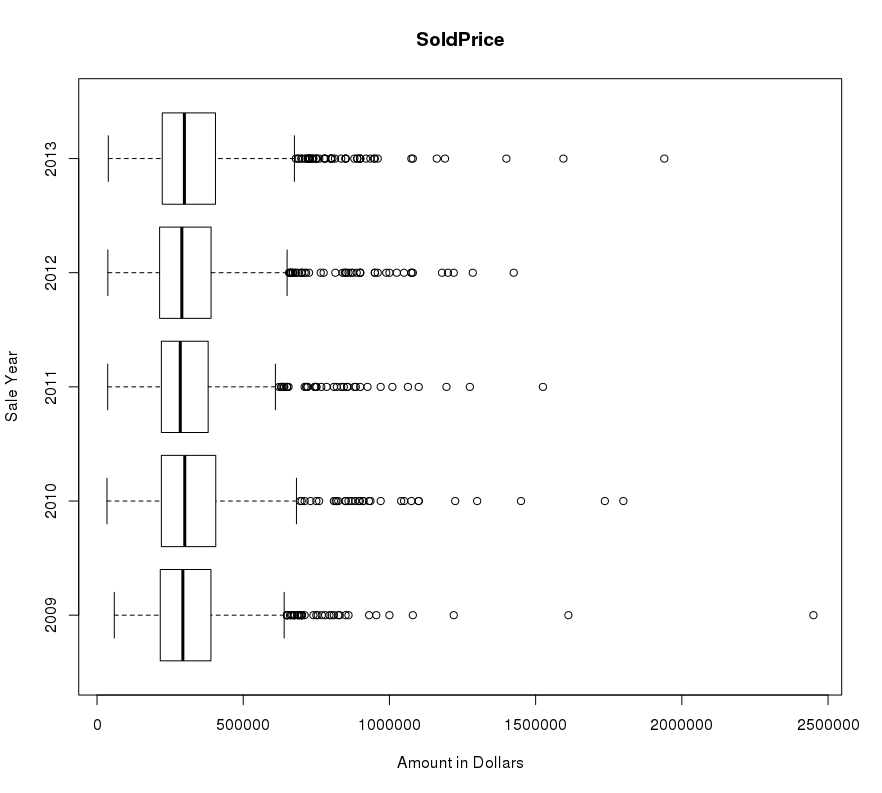
Sold Price in Constant 2013 Dollars
Data Set: Selling
Variable: SoldPrice.Constant2013
Population: A housing transaction that sold on the housing market
Class: Numeric
N: See Selling Table Description at top of page
Missing: 0
Range: 35,920.9 - 2,613,022.8
SD: 183,061.8