This page provides basic descriptions of the key variables used in this study after they were prepared.
Datasets for Residential Properties with an Improvement (Building)
LOCATION: Information on location the property
HOUSING: Information on the physical characteristics of the house at the time of the selling
SELLING: Information on when a property was sold
Location:
| Year | N | Unit of Observation |
|---|---|---|
| 2010-2014 |
15,170 |
Property |
Housing:
| Year | N | Unit of Observation |
|---|---|---|
| 2009 | 2,676 | Year-Property |
|
2010 |
2,633 | Year-Property |
| 2011 | 2,384 | Year-Property |
| 2012 | 2,815 | Year-Property |
| 2013 | 2,986 | Year-Property |
| 2014 | 2,781 | Year-Property |
Selling:
| Year | N | Unit of Observation |
|---|---|---|
| 2009 | 2,676 | Transaction |
|
2010 |
2,633 | Transaction |
| 2011 | 2,384 | Transaction |
| 2012 | 2,815 | Transaction |
| 2013 | 2,986 | Transaction |
| 2014 | 2,781 | Transaction |
Original Data unit of observation was a MLS transaction where a house sold. The table below shows the frequency that a single property appears (i.e. a property that appears twice was sold 2 times between 2010 and 2014
| Once | Two times | Three times | Four times |
|---|---|---|---|
|
14,104 |
1,027 | 38 | 1 |
Data Elements (Click or Scroll Down to see Description)
- Property Type
- Number of Units
- Year Built
- Number of Bedrooms
- Presence of a Bathroom
- Heating Fuel
- Original List Price
- Original List Price in Constant 2013 Dollars
- Closing Price
- Closing Price in Constant 2013 Dollars
Note:
The variables mentioned in the data description below that have a suffix of ACS are those data that were recoded to match the categorization that ACS uses.
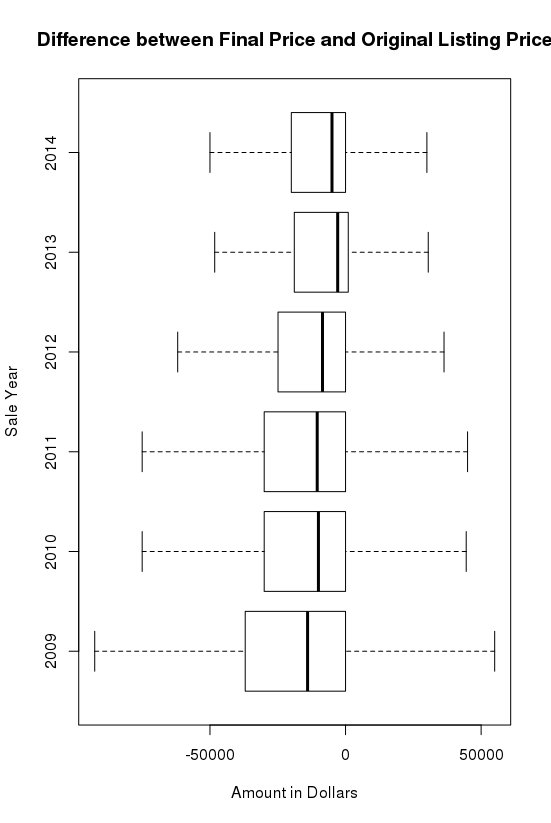
The box plots presented below have outliers hidden. A box plot is a graphical rendition of statistical data based on the minimum, first quartile, median, third quartile, and maximum.
Property Type
Data Set: Housing
Variable: PropertyTypeACS
Population: Residential properties that were sold on the housing market
Class: Factor
Frequency:
| Year | N | Missing |
Condo |
Single Family-Attached |
Single Family Detached |
Unknown |
|
|---|---|---|---|---|---|---|---|
| 2009 | 2,676 | 0 | 1,169 (44%) | 504 (19%) | 993 (37%) | 10 (0%) | |
| 2010 | 2,633 | 0 | 1,088 (41%) | 1,011 (38%) | 524 (20%) | 10 (0%) | |
| 2011 | 2,384 | 0 | 973 (41) | 476 (20%) | 976 (39%) | 8 (0%) | |
| 2012 | 2,815 | 0 | 1,157 (41%) | 542 (19%) | 1,107 (39%) | 9 (0%) | |
| 2013 | 2,986 | 0 | 1,297 (43%) | 573 (19%) | 1,110 (37%) | 6 (0%) | |
| 2014 | 2,781 | 0 | 1,180 (42%) | 546 (20%) | 1,047(38%) | (8%) |
Number of Units
Data Set: Housing
Variable: NumberofUnitsACS
Population: Residential properties that were sold on the housing market
Class: Factor
Frequency:
| Year | N | Missing |
Unknown Condo Building** |
Single Family-Attached |
Single Family Detached |
Unknown |
|
|---|---|---|---|---|---|---|---|
| 2009 | 2,676 | 0 | 1,169 (44%) | 504 (19%) | 993 (37%) | 10 (0%) | |
| 2010 | 2,633 | 0 | 1,088 (41%) | 1,011 (38%) | 524 (20%) | 10 (0%) | |
| 2011 | 2,384 | 0 | 973 (41) | 476 (20%) | 976 (39%) | 8 (0%) | |
| 2012 | 2,815 | 0 | 1,157 (41%) | 542 (19%) | 1,107 (39%) | 9 (0%) | |
| 2013 | 2,986 | 0 | 1,297 (43%) | 573 (19%) | 1,110 (37%) | 6 (0%) | |
| 2014 | 2,781 | 0 | 1,180 (42%) | 546 (20%) | 1,047(38%) | (8%) |
** All we know are the approximate number of floors
Year Built
Data Set: Housing
Variable: YearBuiltACS
Population: Residential properties that were sold on the housing market
Class: Factor
Frequency:
| Year | N | Missing |
1939 or earlier |
1940 - 1949 |
1950 - 1959 |
1960 - 1969 |
1970 - 1979 |
1980 - 1989 |
1990 - 1999 |
2000 - 2009 |
2010 or later |
|
|---|---|---|---|---|---|---|---|---|---|---|---|---|
| 2009 | 2,676 | 0 | 309 (12% | 580 (22%) | 381 (14%) | 209 (8%) | 131 (5%) | 264 (10%) | 159 (6%) | 641 (24%) | 2 | |
| 2010 | 2,633 | 0 | 296 (11%) | 584 (22%) | 387 (15%) | 183 (7%) | 91 (3%) | 348 (12%) | 151 (6%) | 543 (21%) | 70 (3%) | |
| 2011 | 2,384 | 0 | 270 (11%) | 499 (21%) | 339 (14%) | 183 (8%) | 91 (4%) | 274 (11%) | 169 (7%) | 451 (19%) | 108 (5%) | |
| 2012 | 2,815 | 0 | 305 (11%) | 622 (22%) | 419 (15%) | 204 (7%) | 124 (4%) | 297 (11%) | 166 (6%) | 505 (18%) | 173 (6%) | |
| 2013 | 2,986 | 0 | 304 (11%) | 607 (20%) | 443 (15%) | 196 (7%) | 126 (4%) | 341 (11%) | 184 (6%) | 617 (21%) | 168 (6%) | |
| 2014 | 2,781 | 0 | 305 (11%) | 589 (21%) | 394 (14%) | 167 (6%) | 129 (5%) | 339 (12%) | 169 (6%) | 542 (19%) | 147 (5%) |
Number of Bedrooms
Data Set: Housing
Variable: BedsACS
Population: Residential properties that were sold on the housing market
Class: Factor
Frequency:
| Year | N | Missing | 0 | 1 | 2 | 3 | 4 | 5 or more | |
|---|---|---|---|---|---|---|---|---|---|
| 2009 | 2,676 | 0 | 55 (2%) | 527 (20%) | 907 (34%) | 640 (24%) | 349 (13%) | 198 (7%) | |
| 2010 | 2,633 | 0 | 61 (2%) | 512 (19%) | 816 (31%) | 666 (25%) | 372 (14%) | 206 (8%) | |
| 2011 | 2,384 | 0 | 40 (2%) | 449 (19%) | 782 (33%) | 623 (26%) | 305 (13%) | 185 (8%) | |
| 2012 | 2,815 | 0 | 39 (1%) | 555 (20%) | 864 (31%) | 717 (25%) | 419 (15%) | 221 (8%) | |
| 2013 | 2,986 | 0 | 45 (2%) | 622 (21%) | 962 (32%) | 690 (23%) | 393 (13%) | 274 (9%) | |
| 2014 | 2,781 | 0 | 62 (2%) | 557 (20%) | 859 (31%) | 672 (24%) | 394 (14%) | 237 (9%) |
Presence of a Bathroom
Data Set: Housing
Variable: BathsACS
Population: Residential properties that were sold on the housing market
Class: Factor
Frequency:
| Year | N | Missing | With at least 1 Full Bath | No Full Bath | |
|---|---|---|---|---|---|
| 2009 | 2,676 | 0 | 2,632 (100%) | 1 (0%) | |
| 2010 | 2,633 | 0 | 2,632 (100%) | 1 (0%) | |
| 2011 | 2,384 | 0 | 2,383 (100%) | 1 (0%) | |
| 2012 | 2,815 | 0 | 2,815 (100%) | 0 (0%) | |
| 2013 | 2,986 | 0 | 2,986 (100%) | 0 (0%) | |
| 2014 | 2,781 | 0 | 2,780 (100%) | 1 (0%) |
Heating Fuel
Data Set: Housing
Variable: HeatingACS
Population: Residential properties that were sold on the housing market
Class: Factor
Frequency:
| Year | N | Missing |
Coal or Coke |
Electricity |
Fuel oil, kerosene, etc. |
No Fuel Used | Other Fuel | Unknown | Utility gas | Wood | |
|---|---|---|---|---|---|---|---|---|---|---|---|
| 2009 | 2,676 | 0 | 1 (0%) | 891 (33%) | 30 (1%) | 5 (0%) | 58 (2%) | 124 (5%) | 15,567 (59%) | 0 (0%) | |
| 2010 | 2,633 | 0 | 1 (0%) | 865 (33%) | 30 (1%) | 5 (0%) | 55 (2%) | 136 (5%) | 15,41 (59%) | 0 (0%) | |
| 2011 | 2,384 | 0 | 0 (0%) | 787 (33%) | 22 (1%) | 3 (0%) | 30 (1%) | 148 (6%) | 1,394 (58%) | 0 (0%) | |
| 2012 | 2,815 | 0 | 0 (0%) | 922 (33%) | 23 (1%) | 3 (0%) | 3 1%) | 178 (6%) | 1,654 (59%) | 0 (0%) | |
| 2013 | 2,986 | 0 | 0 (0%) | 1,085 (36%) | 23 (1%) | 0 (0%) | 43 (1%) | 153 (5%) | 1,681 (56%) | 1 (0%) | |
| 2014 | 2,781 | 0 | 0 (0%) | 989 (36%) | 21 (1%) | 1 (0%) | 34 (1%) | 129 (5%) | 1,607 (58%) | 0 (0%) |
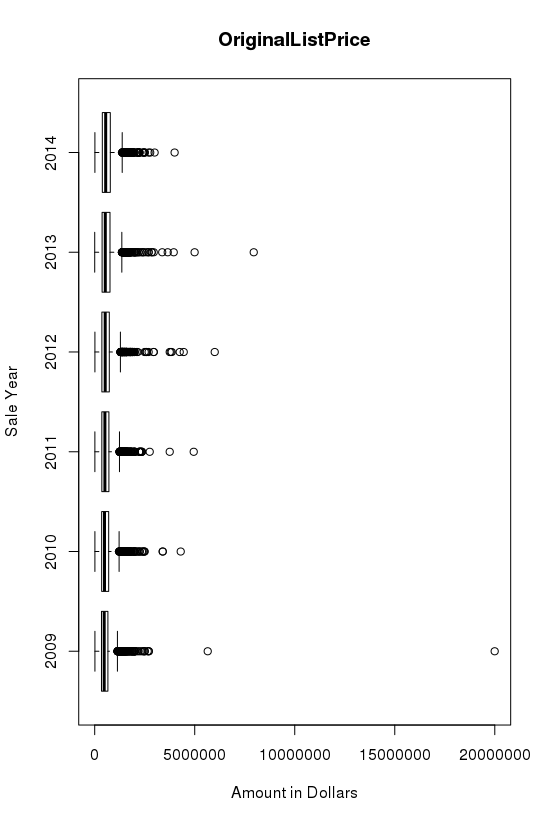
Original List Price
Data Set: Selling
Variable: OriginalListPrice
Population: A housing transaction that sold on the housing market
Class: Numeric
N: See above description of selling data
Missing: 0
Range: 1,000 — 21,325,466
SD: 409,542
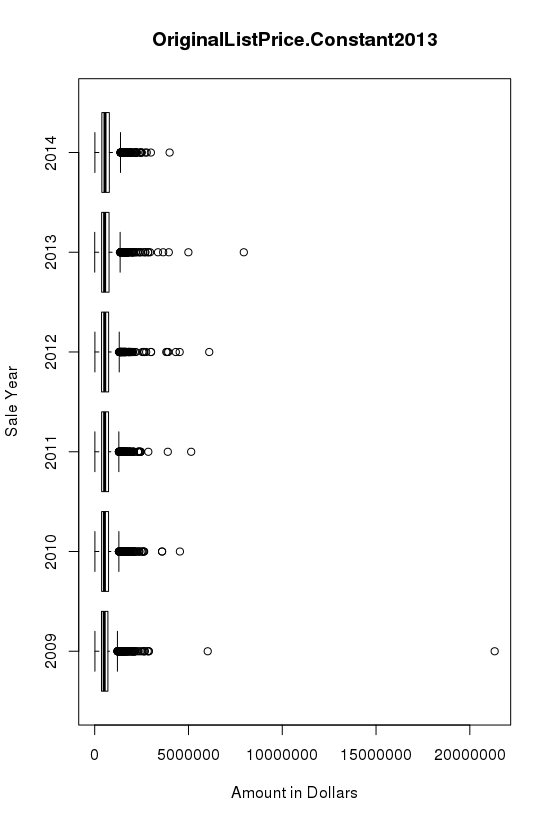
Original List Price in Constant 2013 Dollars
Data Set: Selling
Variable: OriginalListPrice.Constant2013
Population: A housing transaction that sold on the housing market
Class: Numeric
N: See above description of selling data
Missing: 0
Range: 1,000 — 19,995,000
SD: 397,576
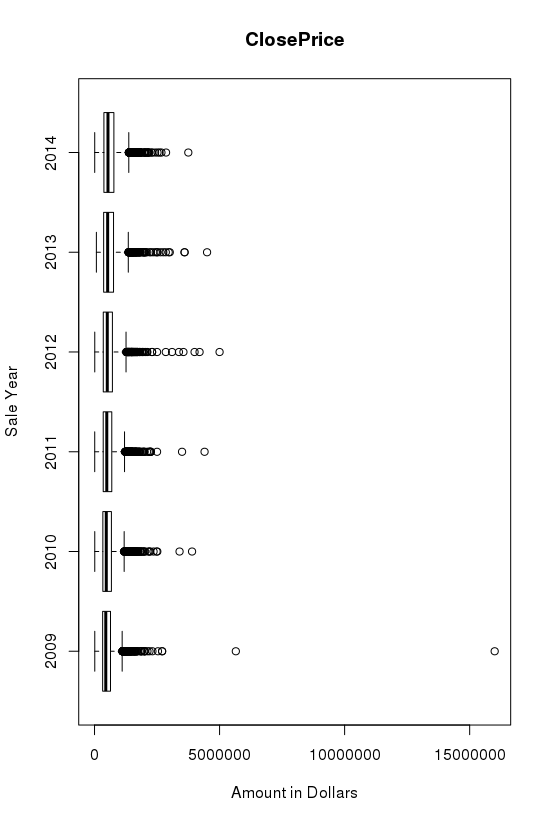
Closing Price
Data Set: Selling
Variable: ClosePrice
Population: A housing transaction that sold on the housing market
Class: Numeric
N: See above description of selling data
Missing: 0
Range: 7,800 — 16,000,000
SD: 364,086
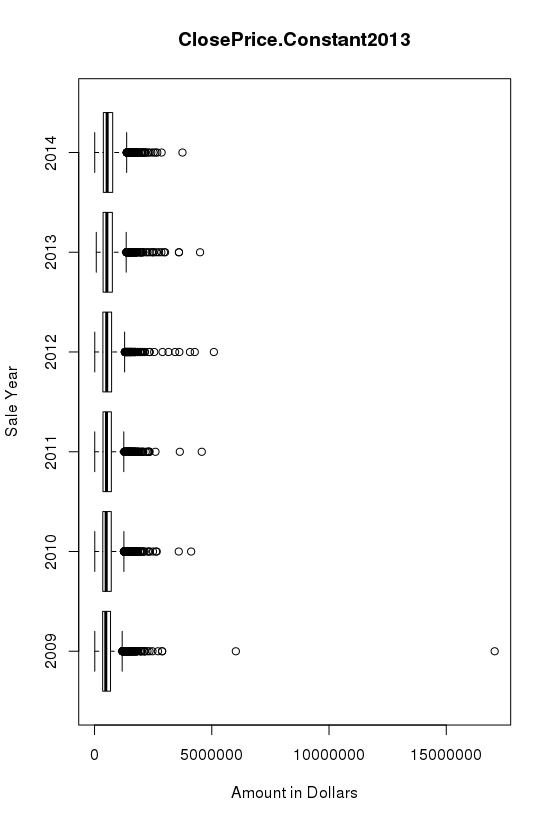
Closing Price in Constant 2013 Dollars
Data Set: Selling
Variable: ClosePrice.Constant2013
Population: A housing transaction that sold on the housing market
Class: Numeric
N: See above description of selling data
Missing: 0
Range: 7,800 — 17,064,639
SD: 374,149