Notes:
- Bolded: ACS 90% MOE crosses 0 (no data still with MOE)
- Weighted by the number of units
- 2009 does not have unit counts, thus could not weight that year
- NA's were removed in total and estimates
- The ACS does not provide 1 year estimates for 2009 in JCC. 2009 estimates are used though to create the 5 year estimate
- All prepared CoreLogic data are used in the tabulations. When calculating census tract and block group (bg) comparisons, only those data that are within a designated tract/bg are include. When geocoding addresses along the county boarder, rooftop coordinates can occur outside the county. When merging tract to coordinates, these properties would not receive a tract/BG ID number
5 year
| Geography: | James City County, Virginia | |||||
|---|---|---|---|---|---|---|
| Dataset: 2009-2013 5-year | B25034 YEAR STRUCTURE BUILT [Universe: Housing units] | |||||
| Description of Variable | ACS Benchmark | Direct Estimate from CoreLogic | ||||
| Estimate | 90%MOE | SE | Estimate | Difference | Within 90%MOE? | |
| Total: | 30,253 | 84 | 51 | 25,815 | 4,438 | NO |
| Built 2010 or later | 350 | 148 | 90 | 702 | -352 | NO |
| Built 2000 to 2009 | 9,508 | 588 | 357 | 8,321 | 1,187 | NO |
| Built 1990 to 1999 | 7,085 | 544 | 331 | 6,133 | 952 | NO |
| Built 1980 to 1989 | 6,619 | 553 | 336 | 5,523 | 1,096 | NO |
| Built 1970 to 1979 | 3,872 | 488 | 297 | 2,404 | 1,468 | NO |
| Built 1960 to 1969 | 1,170 | 225 | 137 | 1,137 | 33 | YES |
| Built 1950 to 1959 | 838 | 207 | 126 | 725 | 113 | YES |
| Built 1940 to 1949 | 441 | 183 | 111 | 201 | 240 | NO |
| Built 1939 or earlier | 370 | 133 | 81 | 378 | -8 | YES |
1 year
| Geography: | James City County, Virginia | |||||
|---|---|---|---|---|---|---|
| Dataset: 2009 1-year | B25034 YEAR STRUCTURE BUILT [Universe: Housing units] | |||||
| Description of Variable | ACS Benchmark | Direct Estimate from CoreLogic | ||||
| Estimate | 90%MOE | SE | Estimate | Difference | Within 90%MOE? | |
| Total | 24,624 | |||||
| Built 2005 or later | 3,652 | |||||
| Built 2000 to 2004 | 4,418 | |||||
| Built 1990 to 1999 | 5,268 | |||||
| Built 1980 to 1989 | 5,507 | |||||
| Built 1970 to 1979 | 2,347 | |||||
| Built 1960 to 1969 | 1,134 | |||||
| Built 1950 to 1959 | 723 | |||||
| Built 1940 to 1949 | 197 | |||||
| Built 1939 or earlier | 378 | |||||
| NA | 240 | |||||
| Geography: | James City County, Virginia | |||||
|---|---|---|---|---|---|---|
| Dataset: 2010 1-year | B25034 YEAR STRUCTURE BUILT [Universe: Housing units] | |||||
| Description of Variable | ACS Benchmark | Direct Estimate from CoreLogic | ||||
| Estimate | 90%MOE | SE | Estimate | Difference | Within 90%MOE? | |
| Total: | 29,882 | 391 | 238 | 25,353 | 4,529 | NO |
| Built 2005 or later | 4,424 | 1,029 | 626 | 4,128 | 296 | YES |
| Built 2000 to 2004 | 4,537 | 834 | 507 | 4,471 | 66 | YES |
| Built 1990 to 1999 | 6,967 | 1,187 | 722 | 6,352 | 615 | YES |
| Built 1980 to 1989 | 6,727 | 1,186 | 721 | 5,529 | 1,198 | NO |
| Built 1970 to 1979 | 4,150 | 1,154 | 702 | 2,417 | 1,733 | NO |
| Built 1960 to 1969 | 1,743 | 740 | 450 | 1,140 | 603 | YES |
| Built 1950 to 1959 | 778 | 336 | 204 | 723 | 55 | YES |
| Built 1940 to 1949 | 459 | 397 | 241 | 201 | 258 | YES |
| Built 1939 or earlier | 97 | 126 | 77 | 392 | -295 | NO |
| NA | 660 | |||||
| Geography: | James City County, Virginia | |||||
|---|---|---|---|---|---|---|
| Dataset: 2011 1-year | B25034 YEAR STRUCTURE BUILT [Universe: Housing units] | |||||
| Description of Variable | ACS Benchmark | Direct Estimate from CoreLogic | ||||
| Estimate | 90%MOE | SE | Estimate | Difference | Within 90%MOE? | |
| Total: | 30,282 | 199 | 121 | 25,710 | 4,572 | NO |
| Built 2005 or later | 3,299 | 1,053 | 640 | 4,488 | -1,189 | NO |
| Built 2000 to 2004 | 6,060 | 1,433 | 871 | 4,471 | 1,589 | NO |
| Built 1990 to 1999 | 7,357 | 1,344 | 817 | 6,350 | 1,007 | YES |
| Built 1980 to 1989 | 6,960 | 1,545 | 939 | 5,529 | 1,431 | YES |
| Built 1970 to 1979 | 4,424 | 1,425 | 866 | 2,417 | 2,007 | NO |
| Built 1960 to 1969 | 850 | 415 | 252 | 1,139 | -289 | YES |
| Built 1950 to 1959 | 643 | 422 | 257 | 724 | -81 | YES |
| Built 1940 to 1949 | 0 | 210 | 128 | 199 | -199 | YES |
| Built 1939 or earlier | 689 | 436 | 265 | 393 | 296 | YES |
| NA | 651 | |||||
| Geography: | James City County, Virginia | |||||
|---|---|---|---|---|---|---|
| Dataset: 2012 1-year | B25034 YEAR STRUCTURE BUILT [Universe: Housing units] | |||||
| Description of Variable | ACS Benchmark | Direct Estimate from CoreLogic | ||||
| Estimate | 90%MOE | SE | Estimate | Difference | Within 90%MOE? | |
| Total: | 30,623 | 246 | 150 | 26,689 | 3,934 | NO |
| Built 2010 or later | 369 | 292 | 178 | 1,103 | -734 | NO |
| Built 2000 to 2009 | 10,386 | 1,416 | 861 | 8,394 | 1,992 | NO |
| Built 1990 to 1999 | 7,028 | 1,242 | 755 | 6,350 | 678 | YES |
| Built 1980 to 1989 | 6,640 | 1,402 | 852 | 5,528 | 1,112 | YES |
| Built 1970 to 1979 | 3,130 | 853 | 519 | 2,419 | 711 | YES |
| Built 1960 to 1969 | 1,440 | 621 | 378 | 1,135 | 305 | YES |
| Built 1950 to 1959 | 584 | 387 | 235 | 725 | -141 | YES |
| Built 1940 to 1949 | 774 | 573 | 348 | 202 | 572 | YES |
| Built 1939 or earlier | 272 | 35 | 21 | 371 | -99 | NO |
| NA | 605 | |||||
| Geography: | James City County, Virginia | |||||
|---|---|---|---|---|---|---|
| Dataset: 2013 1-year | B25034 YEAR STRUCTURE BUILT [Universe: Housing units] | |||||
| Description of Variable | ACS Benchmark | Direct Estimate from CoreLogic | ||||
| Estimate | 90%MOE | SE | Estimate | Difference | Within 90%MOE? | |
| Total: | 30,986 | 277 | 168 | 26,701 | 4,285 | NO |
| Built 2010 or later | 1,123 | 463 | 281 | 1,579 | -456 | YES |
| Built 2000 to 2009 | 9,128 | 1,608 | 978 | 8,408 | 720 | YES |
| Built 1990 to 1999 | 5,818 | 955 | 581 | 6,347 | -529 | YES |
| Built 1980 to 1989 | 7,887 | 1,593 | 968 | 5,523 | 2,364 | NO |
| Built 1970 to 1979 | 4,337 | 995 | 605 | 2,420 | 1,917 | NO |
| Built 1960 to 1969 | 1,427 | 634 | 385 | 1,135 | 292 | YES |
| Built 1950 to 1959 | 558 | 394 | 240 | 729 | -171 | YES |
| Built 1940 to 1949 | 531 | 470 | 286 | 204 | 327 | YES |
| Built 1939 or earlier | 177 | 195 | 119 | 356 | -179 | YES |
| NA | 593 | |||||
5 year
| Geography: | James City County, Virginia | ||||
|---|---|---|---|---|---|
| Dataset: 2009-2013 5-year | B25034 YEAR STRUCTURE BUILT [Universe: Housing units] | ||||
| Description of Variable | ACS Benchmark | Direct Estimate from CoreLogic | |||
| Estimate | 90%MOE | Estimate | Difference | Within 90%MOE? | |
| Total | 30,253 | 84 | 25,815 | 4,438 | NO |
| Built 2010 or later | 1.16% | 0.14% | 2.72% | -1.56% | NO |
| Built 2000 to 2009 | 31.43% | 0.55% | 32.23% | -0.80% | NO |
| Built 1990 to 1999 | 23.42% | 0.51% | 23.76% | -0.34% | YES |
| Built 1980 to 1989 | 21.13% | 0.52% | 21.39% | -0.27% | YES |
| Built 1970 to 1979 | 12.80% | 0.46% | 9.31% | 3.49% | NO |
| Built 1960 to 1969 | 3.87% | 0.21% | 4.40% | -0.54% | NO |
| Built 1950 to 1959 | 2.77% | 0.19% | 2.81% | -0.04% | YES |
| Built 1940 to 1949 | 1.46% | 0.17% | 0.78% | 0.68% | NO |
| Built 1939 or earlier | 1.22% | 0.12% | 1.46% | -0.24% | NO |
1 year
| Geography: | James City County, Virginia | ||||
|---|---|---|---|---|---|
| Dataset: 2010 1-year | B25034 YEAR STRUCTURE BUILT [Universe: Housing units] | ||||
| Description of Variable | ACS Benchmark | Direct Estimate from CoreLogic | |||
| Estimate | 90%MOE | Estimate | Difference | Within 90%MOE? | |
| Total | 29,882 | 391 | 25,353 | 4,529 | NO |
| Built 2005 or later | 14.80% | 0.98% | 16.28% | -1.48% | NO |
| Built 2000 to 2004 | 14.21% | 0.79% | 17.63% | -3.43% | NO |
| Built 1990 to 1999 | 23.32% | 1.13% | 25.05% | -1.74% | NO |
| Built 1980 to 1989 | 22.51% | 1.13% | 21.81% | 0.70% | YES |
| Built 1970 to 1979 | 13.89% | 1.10% | 9.53% | 4.35% | NO |
| Built 1960 to 1969 | 5.83% | 0.70% | 4.50% | 1.34% | NO |
| Built 1950 to 1959 | 2.60% | 0.32% | 2.85% | -0.25% | YES |
| Built 1940 to 1949 | 1.54% | 0.38% | 0.79% | 0.74% | NO |
| Built 1939 or earlier | 0.32% | 0.12% | 1.55% | -1.22% | NO |
| NA | 1.11% | ||||
| Geography: | James City County, Virginia | ||||
|---|---|---|---|---|---|
| Dataset: 2011 1-year | B25034 YEAR STRUCTURE BUILT [Universe: Housing units] | ||||
| Description of Variable | ACS Benchmark | Direct Estimate from CoreLogic | |||
| Estimate | 90%MOE | Estimate | Difference | Within 90%MOE? | |
| Total | 30,282 | 199 | 25,710 | 4,572 | NO |
| Built 2005 or later | 10.89% | 0.99% | 17.46% | -6.56% | NO |
| Built 2000 to 2004 | 20.01% | 1.34% | 17.39% | 2.62% | NO |
| Built 1990 to 1999 | 24.29% | 1.26% | 24.70% | -0.40% | YES |
| Built 1980 to 1989 | 22.98% | 1.45% | 21.51% | 1.48% | NO |
| Built 1970 to 1979 | 14.61% | 1.34% | 9.40% | 5.21% | NO |
| Built 1960 to 1969 | 2.81% | 0.39% | 4.43% | -1.62% | NO |
| Built 1950 to 1959 | 2.12% | 0.40% | 2.82% | -0.69% | NO |
| Built 1940 to 1949 | 0.00% | 0.20% | 0.77% | -0.77% | NO |
| Built 1939 or earlier | 2.28% | 0.41% | 1.53% | 0.75% | NO |
| NA | 0.64% | ||||
| Geography: | James City County, Virginia | ||||
|---|---|---|---|---|---|
| Dataset: 2012 1-year | B25034 YEAR STRUCTURE BUILT [Universe: Housing units] | ||||
| Description of Variable | ACS Benchmark | Direct Estimate from CoreLogic | |||
| Estimate | 90%MOE | Estimate | Difference | Within 90%MOE? | |
| Total | 30,623 | 246 | 26,689 | 3,934 | NO |
| Built 2010 or later | 1.20% | 0.27% | 4.13% | -2.93% | NO |
| Built 2000 to 2009 | 33.92% | 1.32% | 31.45% | 2.46% | NO |
| Built 1990 to 1999 | 22.95% | 1.15% | 23.79% | -0.84% | YES |
| Built 1980 to 1989 | 21.68% | 1.30% | 20.71% | 0.97% | YES |
| Built 1970 to 1979 | 10.22% | 0.79% | 9.06% | 1.16% | NO |
| Built 1960 to 1969 | 4.70% | 0.58% | 4.25% | 0.45% | YES |
| Built 1950 to 1959 | 1.91% | 0.36% | 2.72% | -0.81% | NO |
| Built 1940 to 1949 | 2.53% | 0.53% | 0.76% | 1.77% | NO |
| Built 1939 or earlier | 0.89% | 0.03% | 1.39% | -0.50% | NO |
| NA | 0.59% | ||||
| Geography: | James City County, Virginia | ||||
|---|---|---|---|---|---|
| Dataset: 2013 1-year | B25034 YEAR STRUCTURE BUILT [Universe: Housing units] | ||||
| Description of Variable | ACS Benchmark | Direct Estimate from CoreLogic | |||
| Estimate | 90%MOE | Estimate | Difference | Within 90%MOE? | |
| Total | 30,986 | 277 | 26,701 | 4,285 | NO |
| Built 2010 or later | 3.62% | 0.42% | 5.91% | -2.29% | NO |
| Built 2000 to 2009 | 29.46% | 1.47% | 31.49% | -2.03% | NO |
| Built 1990 to 1999 | 18.78% | 0.87% | 23.77% | -4.99% | NO |
| Built 1980 to 1989 | 25.45% | 1.45% | 20.68% | 4.77% | NO |
| Built 1970 to 1979 | 14.00% | 0.91% | 9.06% | 4.93% | NO |
| Built 1960 to 1969 | 4.61% | 0.58% | 4.25% | 0.35% | YES |
| Built 1950 to 1959 | 1.80% | 0.36% | 2.73% | -0.93% | NO |
| Built 1940 to 1949 | 1.71% | 0.43% | 0.76% | 0.95% | NO |
| Built 1939 or earlier | 0.57% | 0.18% | 1.33% | -0.76% | NO |
| NA | 0.57% | ||||
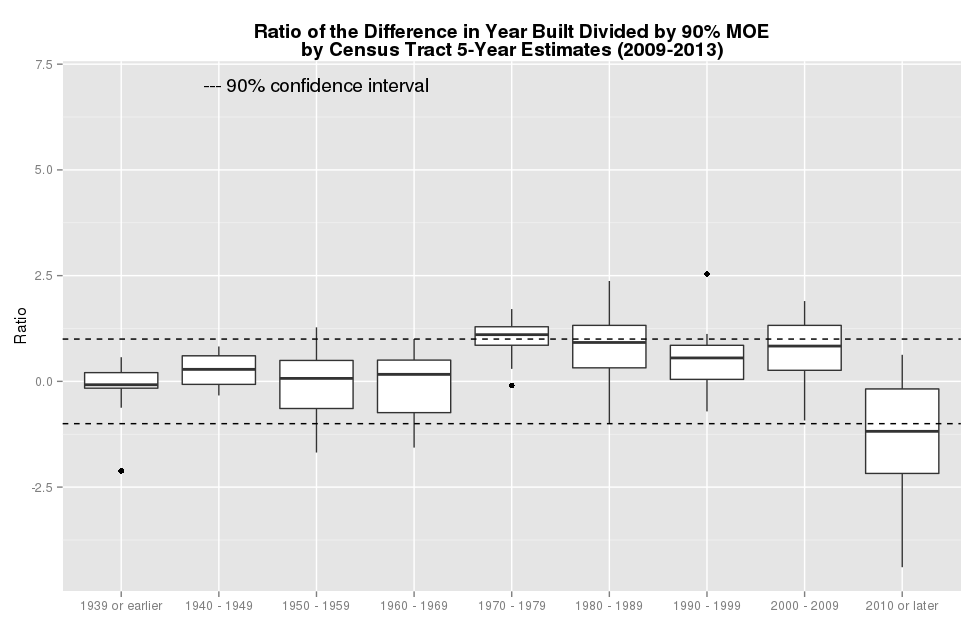
Census Tract
Unit of Observation: Tract (11)
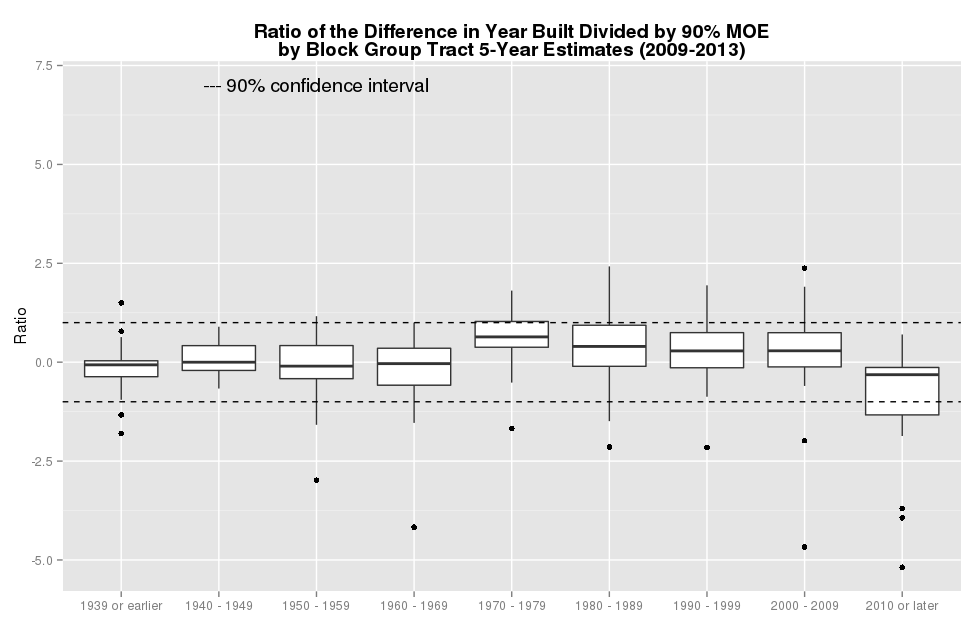
Block Group
Unit of Observation: Block Group (27)