Prepared Data Description
Table of N by Year
|
Year
|
N
|
Weighted-N |
Unit of Observation
|
|---|---|---|---|
| 2009 | 24,864 | 24,864 | Property/Housing-Unit |
|
2010 |
25,317 | 26,013 | Property/Housing-Unit |
| 2011 | 25,659 | 26,361 | Property/Housing-Unit |
| 2012 | 26,130 | 26,832 | Property/Housing-Unit |
| 2013 | 26,591 | 27,294 | Property/Housing-Unit |
Data Elements (Click or Scroll Down to see Description)
- Property Type
-
Number of Units in Building
- Year Built
- Number of Bedrooms
- Presence of a Bathroom
- Total Value Amount
- Total Value Amount in Constant 2013 Dollars
- Taxes
- Taxes in Constant 2013 Dollars
Note:
The box plots presented below have outliers hidden. A box plot is a graphical rendition of statistical data based on the minimum, first quartile, median, third quartile, and maximum.
Property Type
Variable: PropertyTypeACS
Population: Residential properties with a building
Weights: Values were weighted base on number of units
Class: Factor
Frequency Table:
| Weighted N | Missing |
Condo |
Mobile Home |
Multifamily |
Single Family-Attached |
Single Family - NEC |
||
|---|---|---|---|---|---|---|---|---|
| 2009 | 24,864 | 0 | 794 | 1 | 152 | 23,906 | 11 | |
| 2010 | 26,013 | 0 | 820 | 0 | 850 | 24,342 | 1 | |
| 2011 | 26,361 | 0 | 841 | 2 | 861 | 24,642 | 15 | |
| 2012 | 26,832 | 0 | 927 | 2 | 861 | 25,031 | 11 | |
| 2013 | 27,294 | 0 | 987 | 2 | 861 | 25,435 | 9 |
Number of Units in Building
Variable: NumberofUnitsACS
Population: Residential properties with a building
Weights: Values were weighted base on number of units
Class: Factor
Frequency Table:
| Weighted N | Missing |
1-Attached |
1-Detached |
2 Units |
3 or 4 units |
5 to 9 units |
10 to 19 units |
20 to 49 units |
50 or more Units | Unknown | ||
|---|---|---|---|---|---|---|---|---|---|---|---|---|
| 2009 | 24,864 | 0 | 794 | 23,906 | 0 | 0 | 0 | 0 | 0 | 0 | 164 | |
| 2010 | 26,013 | 0 | 806 | 24,263 | 0 | 23 | 58 | 124 | 0 | 604 | 135 | |
| 2011 | 26,361 | 0 | 827 | 24,562 | 2 | 34 | 57 | 124 | 0 | 602 | 153 | |
| 2012 | 26,832 | 0 | 913 | 24,950 | 2 | 35 | 57 | 124 | 0 | 602 | 149 | |
| 2013 | 27,294 | 0 | 973 | 25,354 | 2 | 36 | 57 | 124 | 0 | 602 | 146 |
Year Built
Variable: YearBuiltACS
Population: Residential properties with a building
Weights: Values were weighted base on number of units
Class: Factor
Frequency Table:
| Weighted N | Missing |
1939 or earlier |
1940 - 1949 |
1950 - 1959 |
1960 - 1969 |
1970 - 1979 |
1980 - 1989 |
1990 - 1999 |
2000 - 2009 |
2010 or later |
||
|---|---|---|---|---|---|---|---|---|---|---|---|---|
| 2009 | 26,6242 | 240 | 378 | 197 | 723 | 1,134 | 2,347 | 5,507 | 6,268 | 8,070 | 0 | |
| 2010 | 25,353 | 660 | 392 | 201 | 723 | 1,140 | 2,417 | 5,529 | 6,352 | 8,350 | 249 | |
| 2011 | 25,710 | 651 | 393 | 199 | 724 | 1,139 | 2,417 | 5,529 | 6,350 | 8,382 | 557 | |
| 2012 | 2,6227 | 605 | 371 | 202 | 725 | 1,135 | 2,419 | 5,528 | 6,350 | 8,394 | 1,103 | |
| 2013 | 26,701 | 593 | 356 | 204 | 729 | 1,135 | 2,420 | 5,523 | 6,347 | 8,408 | 1,579 |
Number of Bedrooms
Variable: BedCountACS
Population: Residential Dwellings with a building
Weights: Values were weighted base on number of units
Class: Factor
Frequency Table:
| Weighted N | Missing | 0 | 1 | 2 | 3 | 4 | 5 or more | ||
|---|---|---|---|---|---|---|---|---|---|
| 2009 | 21,821 | 3,043 | 0 | 190 | 2,370 | 11,729 | 6,671 | 761 | |
| 2010 | 22,316 | 3,697 | 0 | 192 | 2,463 | 11,976 | 6,904 | 781 | |
| 2011 | 22,696 | 3,665 | 0 | 193 | 2,516 | 12,172 | 7,002 | 813 | |
| 2012 | 23,349 | 3,483 | 0 | 191 | 2,580 | 12,472 | 7,241 | 865 | |
| 2013 | 23,965 | 3,329 | 0 | 196 | 2,647 | 12,742 | 7,453 | 927 |
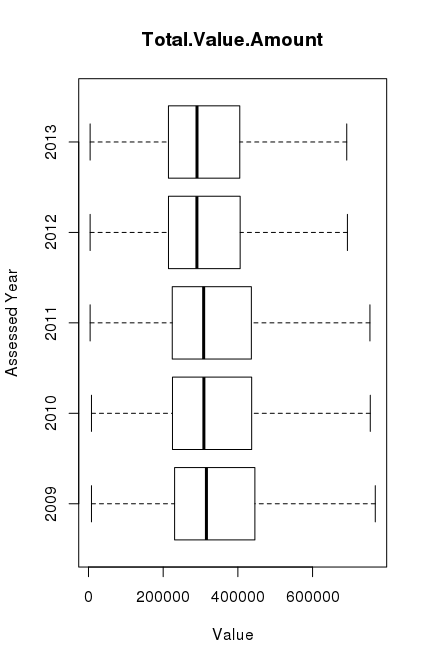
Total Value Amount
Variable: X.TOTAL.VALUE.CALCULATED.
Years: 2009-2013
Population: Residential properties with a building that had an assessment conducted
Exclusion: Removed those classified as multifamily and unknown affordable dwelling. (Renters do not get asked real estate tax questions)
N: See table above for N
Number missing: 0
Class: Numeric
Range: 4,400 – 4,385,900
Standard Deviation: 211,080
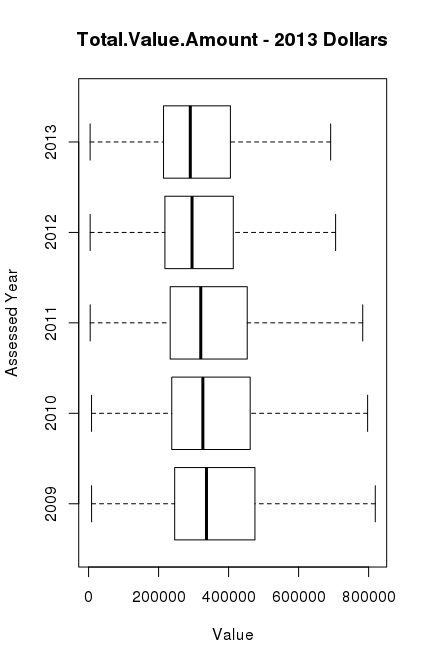
Total Value Amount in Constant 2013 Dollars
Variable: Total.Value.Amount.Constant2013
Years: 2009-2013
Population: Residential properties with a building that had an assessment conducted
Exclusion: Removed those classified as multifamily and unknown affordable dwelling. (Renters do not get asked real estate tax questions)
N: See table above for N
Number missing: 0
Class: Numeric
Range: 4, 400 – 4,677,737
Standard Deviation: 219,329
Taxes Paid
Variable: X.TAX.AMOUNT.
Years: 2009-2014
Population: Residential properties with a building that had an assessment conducted during the year
Exclusion: Removed those classified as multifamily and unknown affordable dwelling. (Renters do not get asked real estate tax questions)
N: See table above for N
Number missing: 1,540
Class: Numeric
Range: 1.54 – 33,771.44
Standard Deviation: 1,647.26
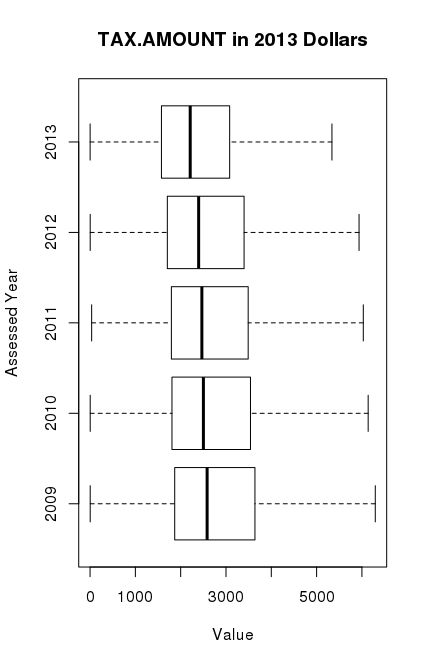
Taxes Paid in Constant 2013 dollars
Variable: TAX.AMOUNT.2013
Years: 2009-2014
Population: Residential properties with a building that had an assessment conducted during the year
Exclusion: Removed those classified as multifamily and unknown affordable dwelling. (Renters do not get asked real estate tax questions)
N: See table above for N
Number missing: 1,540
Class: Numeric
Range: 1.54 – 36,018.59
Standard Deviation: 1,710.73