VT Census Case Studies : B25034: Year Structure Built - CL for AC
Created and last modified by molfe on 04 Jan 2016
Notes:
- Bolded: ACS 90% MOE crosses 0 (no data still with MOE)
- Weighted by the number of units
- NA's were removed in total and estimates
- All prepared CoreLogic data are used in the tabulations. When calculating census tract and block group (bg) comparisons, only those data that are within a designated tract/bg are included. When geocoding addresses along the county boarder, rooftop coordinates can occur outside the county. When merging tract to coordinates, these properties would not receive a tract/BG ID number
5 year
| Geography: | Arlington County, Virginia |
|---|
| Dataset: 2009-2013 5-year | B25034 YEAR STRUCTURE BUILT [Universe: Housing units] |
|---|
| Description of Variable | ACS Benchmark | Direct Estimate from CoreLogic |
|---|
| Estimate | 90%MOE | SE | Estimate | Difference | Within 90%MOE? |
|---|
| Total | 106,740 | 191 | 116 | 84,512 | 22,228 | NO |
|---|
| Built 2010 or later | 1,259 | 222 | 135 | 5,235 | -3,976 | NO |
|---|
| Built 2000 to 2009 | 16,900 | 759 | 461 | 11,118 | 5,782 | NO |
|---|
| Built 1990 to 1999 | 9,770 | 722 | 439 | 6,524 | 3,246 | NO |
|---|
| Built 1980 to 1989 | 12,016 | 639 | 388 | 8,783 | 3,233 | NO |
|---|
| Built 1970 to 1979 | 11,388 | 772 | 469 | 6,001 | 5,387 | NO |
|---|
| Built 1960 to 1969 | 12,425 | 776 | 472 | 12,867 | -442 | YES |
|---|
| Built 1950 to 1959 | 16,769 | 828 | 503 | 15,653 | 1,116 | NO |
|---|
| Built 1940 to 1949 | 16,609 | 724 | 440 | 15,121 | 1,488 | NO |
|---|
| Built 1939 or earlier | 9,604 | 498 | 303 | 7,086 | 2,518 | NO |
|---|
1 year
| Geography: | Arlington County, Virginia |
|---|
| Dataset: 2009 1-year | B25034 YEAR STRUCTURE BUILT [Universe: Housing units] |
|---|
| Description of Variable | ACS Benchmark | Direct Estimate from CoreLogic | |
|---|
| Estimate | 90%MOE | SE | Estimate | Difference | Within 90%MOE? |
|---|
| Total | 103,813 | 872 | 530 | 94,239 | 9,574 | NO |
|---|
| Built 2005 or later | 5,513 | 1,158 | 704 | 4,373 | 1,140 | YES |
|---|
| Built 2000 to 2004 | 9,154 | 1,724 | 1,048 | 4,570 | 4,584 | NO |
|---|
| Built 1990 to 1999 | 8,675 | 1,290 | 784 | 11,642 | -2,967 | NO |
|---|
| Built 1980 to 1989 | 12,107 | 1,855 | 1,128 | 11,642 | 465 | YES |
|---|
| Built 1970 to 1979 | 10,771 | 1,687 | 1,026 | 4,058 | 6,713 | NO |
|---|
| Built 1960 to 1969 | 12,237 | 1,515 | 921 | 15,094 | -2,857 | NO |
|---|
| Built 1950 to 1959 | 18,725 | 2,117 | 1,287 | 17,529 | 1,196 | YES |
|---|
| Built 1940 to 1949 | 18,178 | 2,068 | 1,257 | 20,329 | -2,151 | NO |
|---|
| Built 1939 or earlier | 8,453 | 1,177 | 716 | 9,669 | -1,216 | NO |
|---|
| Geography: | Arlington County, Virginia |
|---|
| Dataset: 2010 1-year | B25034 YEAR STRUCTURE BUILT [Universe: Housing units] |
|---|
| Description of Variable | ACS Benchmark | Direct Estimate from CoreLogic | |
|---|
| Estimate | 90%MOE | SE | Estimate | Difference | Within 90%MOE? |
|---|
| Total | 105,490 | 619 | 376 | 95,171 | 10,319 | NO |
|---|
| Built 2005 or later | 8,435 | 1,398 | 850 | 5,343 | 3,092 | NO |
|---|
| Built 2000 to 2004 | 8,960 | 1,802 | 1,095 | 4,570 | 4,390 | NO |
|---|
| Built 1990 to 1999 | 8,483 | 1,314 | 799 | 6,976 | 1,507 | NO |
|---|
| Built 1980 to 1989 | 13,431 | 1,719 | 1,045 | 11,728 | 1,703 | YES |
|---|
| Built 1970 to 1979 | 9,683 | 1,620 | 985 | 4,058 | 5,625 | NO |
|---|
| Built 1960 to 1969 | 13,096 | 1,757 | 1,068 | 15,130 | -2,034 | NO |
|---|
| Built 1950 to 1959 | 18,012 | 2,205 | 1,340 | 17,445 | 567 | YES |
|---|
| Built 1940 to 1949 | 16,986 | 1,676 | 1,019 | 20,266 | -3,280 | NO |
|---|
| Built 1939 or earlier | 8,404 | 1,190 | 723 | 9,655 | -1,251 | NO |
|---|
| Geography: | Arlington County, Virginia |
|---|
| Dataset: 2011 1-year | B25034 YEAR STRUCTURE BUILT [Universe: Housing units] |
|---|
| Description of Variable | ACS Benchmark | Direct Estimate from CoreLogic | |
|---|
| Estimate | 90%MOE | SE | Estimate | Difference | Within 90%MOE? |
|---|
| Total | 106,720 | 417 | 253 | 78,143 | 28,577 | NO |
|---|
| Built 2005 or later | 10,099 | 2,297 | 1,396 | 5,665 | 4,434 | NO |
|---|
| Built 2000 to 2004 | 10,233 | 2,200 | 1,337 | 4,341 | 5,892 | NO |
|---|
| Built 1990 to 1999 | 10,232 | 2,434 | 1,480 | 5,001 | 5,231 | NO |
|---|
| Built 1980 to 1989 | 10,915 | 2,511 | 1,526 | 10,003 | 912 | YES |
|---|
| Built 1970 to 1979 | 11,385 | 1,939 | 1,179 | 3,300 | 8,085 | NO |
|---|
| Built 1960 to 1969 | 12,647 | 2,882 | 1,752 | 11,610 | 1,037 | YES |
|---|
| Built 1950 to 1959 | 15,628 | 2,113 | 1,284 | 14,054 | 1,574 | YES |
|---|
| Built 1940 to 1949 | 15,351 | 1,832 | 1,114 | 15,520 | -169 | YES |
|---|
| Built 1939 or earlier | 10,230 | 1,450 | 881 | 8,649 | 1,581 | NO |
|---|
| Geography: | Arlington County, Virginia |
|---|
| Dataset: 2012 1-year | B25034 YEAR STRUCTURE BUILT [Universe: Housing units] |
|---|
| Description of Variable | ACS Benchmark | Direct Estimate from CoreLogic | |
|---|
| Estimate | 90%MOE | SE | Estimate | Difference | Within 90%MOE? |
|---|
| Total | 107,734 | 537 | 326 | 76,800 | 30,934 | NO |
|---|
| Built 2010 or later | 1,609 | 455 | 277 | 573 | 1,036 | NO |
|---|
| Built 2000 to 2009 | 16,501 | 1,909 | 1,160 | 11,991 | 4,510 | NO |
|---|
| Built 1990 to 1999 | 9,831 | 1,392 | 846 | 4,431 | 5,400 | NO |
|---|
| Built 1980 to 1989 | 12,709 | 1,907 | 1,159 | 9,050 | 3,659 | NO |
|---|
| Built 1970 to 1979 | 11,609 | 1,613 | 981 | 3,777 | 7,832 | NO |
|---|
| Built 1960 to 1969 | 11,219 | 1,738 | 1,057 | 10,036 | 1,183 | YES |
|---|
| Built 1950 to 1959 | 16,465 | 1,669 | 1,015 | 13,254 | 3,211 | NO |
|---|
| Built 1940 to 1949 | 17,375 | 1,510 | 918 | 15,100 | 2,275 | NO |
|---|
| Built 1939 or earlier | 10,416 | 1,376 | 836 | 8,588 | 1,828 | NO |
|---|
| Geography: | Arlington County, Virginia |
|---|
| Dataset: 2013 1-year | B25034 YEAR STRUCTURE BUILT [Universe: Housing units] |
|---|
| Description of Variable | ACS Benchmark | Direct Estimate from CoreLogic | |
|---|
| Estimate | 90%MOE | SE | Estimate | Difference | Within 90%MOE? |
|---|
| Total | 109,689 | 504 | 306 | 78,207 | 31,482 | NO |
|---|
| Built 2010 or later | 3,849 | 973 | 591 | 16,353 | -12,504 | NO |
|---|
| Built 2000 to 2009 | 17,968 | 1,893 | 1,151 | 12,345 | 5,623 | NO |
|---|
| Built 1990 to 1999 | 12,041 | 1,596 | 970 | 4,570 | 7,471 | NO |
|---|
| Built 1980 to 1989 | 11,868 | 1,850 | 1,125 | 9,076 | 2,792 | NO |
|---|
| Built 1970 to 1979 | 12,318 | 1,507 | 916 | 3,774 | 8,544 | NO |
|---|
| Built 1960 to 1969 | 11,257 | 1,457 | 886 | 10,031 | 1,226 | YES |
|---|
| Built 1950 to 1959 | 14,239 | 1,990 | 1,210 | 13,185 | 1,054 | YES |
|---|
| Built 1940 to 1949 | 15,815 | 1,684 | 1,024 | 15,052 | 763 | YES |
|---|
| Built 1939 or earlier | 10,334 | 1,357 | 825 | 8,539 | 1,795 | NO |
|---|
5 year
| Geography: | Arlington County, Virginia |
|---|
| Dataset: 2009-2013 5-year | B25034 YEAR STRUCTURE BUILT [Universe: Housing units] |
|---|
| Description of Variable | ACS Benchmark | Direct Estimate from CoreLogic |
|---|
| Estimate | 90%MOE | Estimate | Difference | Within 90%MOE? |
|---|
| Total | 106,740 | 191 | 84,512 | 22,228 | NO |
|---|
| Built 2010 or later | 1.18% | 0.21% | 6.19% | -5.01% | NO |
|---|
| Built 2000 to 2009 | 15.83% | 0.71% | 13.16% | 2.68% | NO |
|---|
| Built 1990 to 1999 | 9.15% | 0.68% | 7.72% | 1.43% | NO |
|---|
| Built 1980 to 1989 | 11.26% | 0.60% | 10.39% | 0.86% | NO |
|---|
| Built 1970 to 1979 | 10.67% | 0.72% | 7.10% | 3.57% | NO |
|---|
| Built 1960 to 1969 | 11.64% | 0.73% | 15.23% | -3.58% | NO |
|---|
| Built 1950 to 1959 | 15.71% | 0.78% | 18.52% | -2.81% | NO |
|---|
| Built 1940 to 1949 | 15.56% | 0.68% | 17.89% | -2.33% | NO |
|---|
| Built 1939 or earlier | 9.00% | 0.47% | 8.38% | 0.61% | NO |
|---|
1 year
| Geography: | Arlington County, Virginia |
|---|
| Dataset: 2009 1-year | B25034 YEAR STRUCTURE BUILT [Universe: Housing units] |
|---|
| Description of Variable | ACS Benchmark | Direct Estimate from CoreLogic |
|---|
| Estimate | 90%MOE | Estimate | Difference | Within 90%MOE? |
|---|
| Total | 105,490 | 872 | 94,239 | 11,251 | NO |
|---|
| Built 2005 or later | 5.31% | 1.12% | 4.64% | 0.67% | YES |
|---|
| Built 2000 to 2004 | 8.82% | 1.66% | 4.85% | 3.97% | NO |
|---|
| Built 1990 to 1999 | 8.36% | 1.24% | 12.35% | -4.00% | NO |
|---|
| Built 1980 to 1989 | 11.66% | 1.79% | 12.35% | -0.69% | YES |
|---|
| Built 1970 to 1979 | 10.38% | 1.63% | 4.31% | 6.07% | NO |
|---|
| Built 1960 to 1969 | 11.79% | 1.46% | 16.02% | -4.23% | NO |
|---|
| Built 1950 to 1959 | 18.04% | 2.04% | 18.60% | -0.56% | YES |
|---|
| Built 1940 to 1949 | 17.51% | 2.00% | 21.57% | -4.06% | NO |
|---|
| Built 1939 or earlier | 8.14% | 1.14% | 10.26% | -2.12% | NO |
|---|
| Geography: | Arlington County, Virginia |
|---|
| Dataset: 2010 1-year | B25034 YEAR STRUCTURE BUILT [Universe: Housing units] |
|---|
| Description of Variable | ACS Benchmark | Direct Estimate from CoreLogic |
|---|
| Estimate | 90%MOE | Estimate | Difference | Within 90%MOE? |
|---|
| Total | 105,490 | 619 | 95,171 | 10,319 | NO |
|---|
| Built 2005 or later | 8.00% | 1.33% | 5.61% | 2.38% | NO |
|---|
| Built 2000 to 2004 | 8.49% | 1.71% | 4.80% | 3.69% | NO |
|---|
| Built 1990 to 1999 | 8.04% | 1.25% | 7.33% | 0.71% | YES |
|---|
| Built 1980 to 1989 | 12.73% | 1.63% | 12.32% | 0.41% | YES |
|---|
| Built 1970 to 1979 | 9.18% | 1.54% | 4.26% | 4.92% | NO |
|---|
| Built 1960 to 1969 | 12.41% | 1.67% | 15.90% | -3.48% | NO |
|---|
| Built 1950 to 1959 | 17.07% | 2.10% | 18.33% | -1.26% | YES |
|---|
| Built 1940 to 1949 | 16.10% | 1.60% | 21.29% | -5.19% | NO |
|---|
| Built 1939 or earlier | 7.97% | 1.13% | 10.14% | -2.18% | NO |
|---|
| Geography: | Arlington County, Virginia |
|---|
| Dataset: 2011 1-year | B25034 YEAR STRUCTURE BUILT [Universe: Housing units] |
|---|
| Description of Variable | ACS Benchmark | Direct Estimate from CoreLogic |
|---|
| Estimate | 90%MOE | Estimate | Difference | Within 90%MOE? |
|---|
| Total | 106,720 | 417 | 78,143 | 28,577 | NO |
|---|
| Built 2005 or later | 9.46% | 2.15% | 7.25% | 2.21% | NO |
|---|
| Built 2000 to 2004 | 9.59% | 2.06% | 5.56% | 4.03% | NO |
|---|
| Built 1990 to 1999 | 9.59% | 2.28% | 6.40% | 3.19% | NO |
|---|
| Built 1980 to 1989 | 10.23% | 2.35% | 12.80% | -2.57% | NO |
|---|
| Built 1970 to 1979 | 10.67% | 1.82% | 4.22% | 6.45% | NO |
|---|
| Built 1960 to 1969 | 11.85% | 2.70% | 14.86% | -3.01% | NO |
|---|
| Built 1950 to 1959 | 14.64% | 1.98% | 17.98% | -3.34% | NO |
|---|
| Built 1940 to 1949 | 14.38% | 1.72% | 19.86% | -5.48% | NO |
|---|
| Built 1939 or earlier | 9.59% | 1.36% | 11.07% | -1.48% | NO |
|---|
| Geography: | Arlington County, Virginia |
|---|
| Dataset: 2012 1-year | B25034 YEAR STRUCTURE BUILT [Universe: Housing units] |
|---|
| Description of Variable | ACS Benchmark | Direct Estimate from CoreLogic |
|---|
| Estimate | 90%MOE | Estimate | Difference | Within 90%MOE? |
|---|
| Total | 107,734 | 537 | 76,800 | 30,934 | NO |
|---|
| Built 2010 or later | 1.49% | 0.42% | 0.75% | 0.75% | NO |
|---|
| Built 2000 to 2009 | 15.32% | 1.78% | 15.61% | -0.30% | YES |
|---|
| Built 1990 to 1999 | 9.13% | 1.29% | 5.77% | 3.36% | NO |
|---|
| Built 1980 to 1989 | 11.80% | 1.77% | 11.78% | 0.01% | YES |
|---|
| Built 1970 to 1979 | 10.78% | 1.50% | 4.92% | 5.86% | NO |
|---|
| Built 1960 to 1969 | 10.41% | 1.62% | 13.07% | -2.65% | NO |
|---|
| Built 1950 to 1959 | 15.28% | 1.55% | 17.26% | -1.97% | NO |
|---|
| Built 1940 to 1949 | 16.13% | 1.41% | 19.66% | -3.53% | NO |
|---|
| Built 1939 or earlier | 9.67% | 1.28% | 11.18% | -1.51% | NO |
|---|
| Geography: | Arlington County, Virginia |
|---|
| Dataset: 2013 1-year | B25034 YEAR STRUCTURE BUILT [Universe: Housing units] |
|---|
| Description of Variable | ACS Benchmark | Direct Estimate from CoreLogic |
|---|
| Estimate | 90%MOE | Estimate | Difference | Within 90%MOE? |
|---|
| Total | 109,689 | 504 | 78,207 | 31,482 | NO |
|---|
| Built 2010 or later | 3.51% | 0.89% | 20.91% | -17.40% | NO |
|---|
| Built 2000 to 2009 | 16.38% | 1.73% | 15.79% | 0.60% | YES |
|---|
| Built 1990 to 1999 | 10.98% | 1.46% | 5.84% | 5.13% | NO |
|---|
| Built 1980 to 1989 | 10.82% | 1.69% | 11.61% | -0.79% | YES |
|---|
| Built 1970 to 1979 | 11.23% | 1.38% | 4.83% | 6.40% | NO |
|---|
| Built 1960 to 1969 | 10.26% | 1.33% | 12.83% | -2.56% | NO |
|---|
| Built 1950 to 1959 | 12.98% | 1.82% | 16.86% | -3.88% | NO |
|---|
| Built 1940 to 1949 | 14.42% | 1.54% | 19.25% | -4.83% | NO |
|---|
| Built 1939 or earlier | 9.42% | 1.24% | 10.92% | -1.50% | NO |
|---|
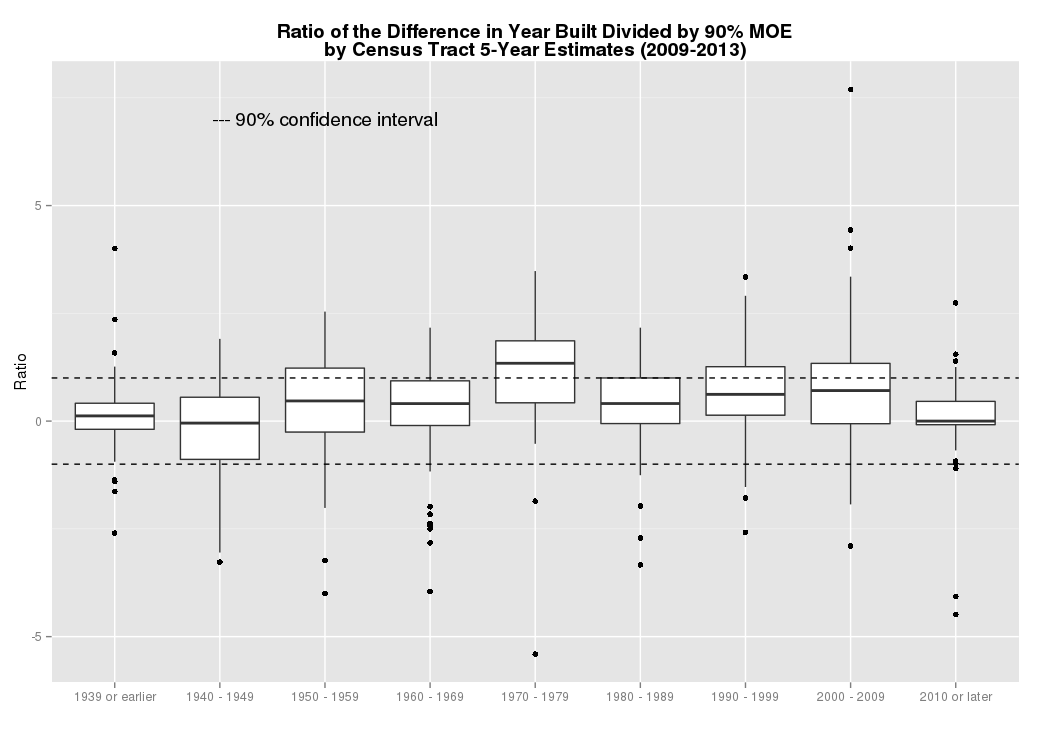
Census Tract
Unit of Observation: Tract (59)
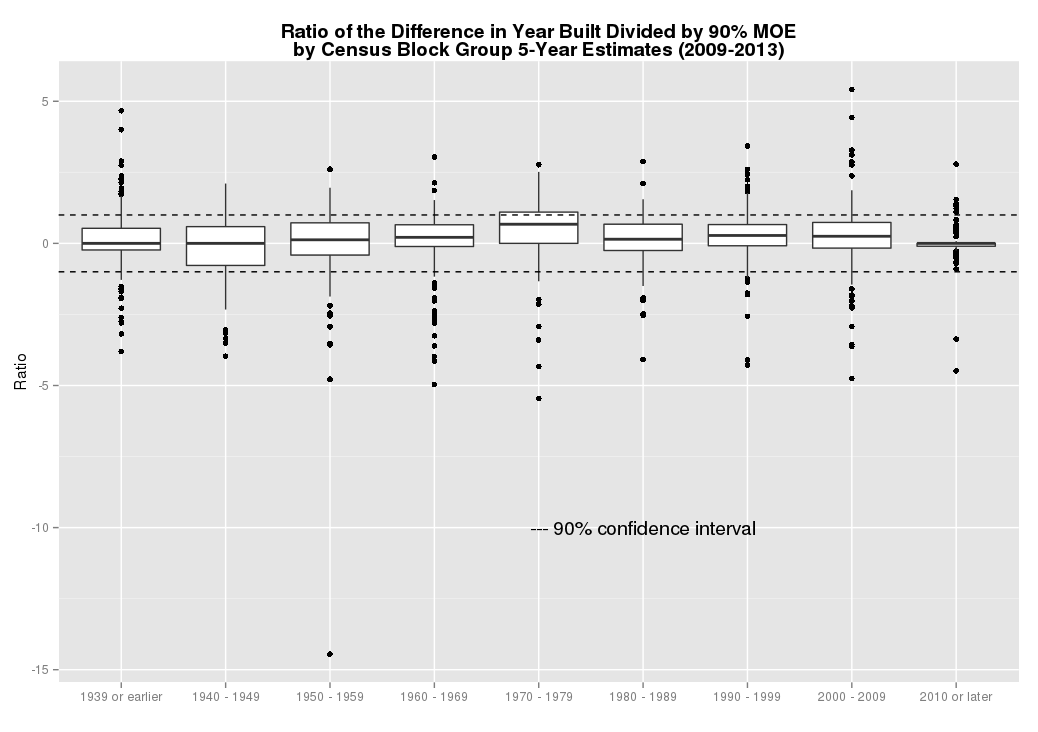
Census Block Group
Unit of Observation: Block Group (181)