Prepared Data Description
Table of N by Year
|
Year
|
N
|
Weighted-N |
Unit of Observation
|
|---|---|---|---|
|
2009 |
59,594 |
97,589 |
Property/Housing-Unit |
|
2010 |
59,960 |
98,690 |
Property/Housing-Unit |
|
2011 |
60,077 |
83,640 |
Property/Housing-Unit |
|
2012 |
60,220 |
79,521 |
Property/Housing-Unit |
|
2013 |
60,343 |
79,804 |
Property/Housing-Unit |
Data Elements (Click or Scroll Down to see Description)
- Property Type
-
Number of Units in Building
- Year Built
- Number of Bedrooms
- Presence of a Bathroom
- Total Value
- Total Value in Constant 2013 Dollars
- Taxes
- Taxes in Constant 2013 Dollars
Note:
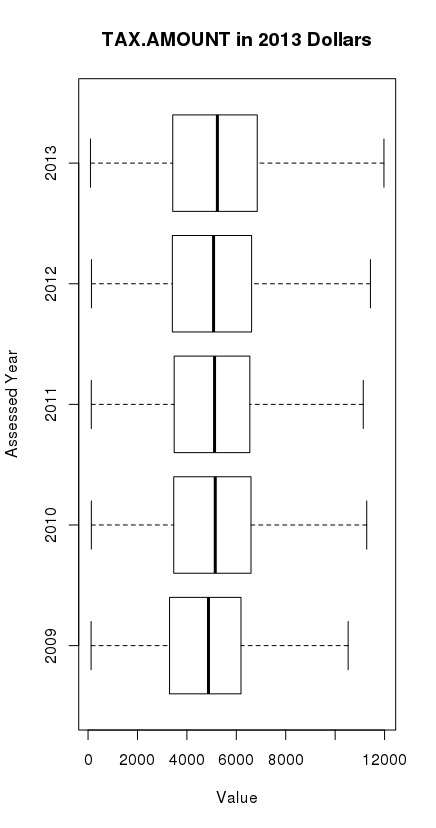
The box plots presented below have outliers hidden. A box plot is a graphical rendition of statistical data based on the minimum, first quartile, median, third quartile, and maximum.
Property Type
Variable: PropertyTypeACS
Population: Residential properties with a building
Weights: Values were weighted base on number of units
Class: Factor
Frequency Table:
| Weighted N | Missing |
Condo |
Multifamily |
Single Family-Attached |
Single Family- Detached |
Single Family- NEC | ||
|---|---|---|---|---|---|---|---|---|
| 2009 | 97,589 | 0 | 26,119 | 38,230 | 3,801 | 27,410 | 2,029 | |
| 2010 | 98,690 | 0 | 26,401 | 38,979 | 3,855 | 27,441 | 2,014 | |
| 2011 | 83,640 | 0 | 26,424 | 23,381 | 4,284 | 27,460 | 2,091 | |
| 2012 | 79,521 | 0 | 26,495 | 19,345 | 4,103 | 27,480 | 2,098 | |
| 2013 | 79,804 | 0 | 26,557 | 19,310 | 4,358 | 27,480 | 2,099 |
Number of Units in Building
Variable: NumberofUnitsACS
Population: Residential properties with a building
Weights: Values were weighted base on number of units
Class: Factor
Frequency Table:
| Weighted N | Missing |
1-Attached |
1-Detached |
Unknown Singe Family | 2 Units |
3 or 4 units |
5 to 9 units |
10 to 19 units |
20 to 49 units |
50 or more Units | Unknown | ||
|---|---|---|---|---|---|---|---|---|---|---|---|---|---|
| 2009 | 97,589 | 0 | 29,340 | 27,336 | 60 | 514 | 85 | 1,011 | 1,421 | 3,037 | 32,729 | 2,056 | |
| 2010 | 98,690 | 0 | 29,697 | 27,370 | 57 | 514 | 89 | 990 | 1,331 | 3,008 | 33,594 | 2,040 | |
| 2011 | 83,640 | 0 | 11,883 | 27,371 | 48 | 744 | 2,621 | 3,794 | 3,795 | 2,224 | 29,112 | 2,048 | |
| 2012 | 79,521 | 0 | 12,300 | 27,440 | 4 | 704 | 2,491 | 3,427 | 3,580 | 1,794 | 25,681 | 2,100 | |
| 2013 | 79,804 | 0 | 12,160 | 27,439 | 5 | 746 | 2,585 | 3,494 | 3,712 | 1,820 | 25,718 | 2,125 |
Year Built
Variable: YearBuiltACS
Population: Residential properties with a building
Weights: Values were weighted base on number of units
Class: Factor
Frequency Table:
| Weighted N | Missing |
1939 or earlier |
1940 - 1949 |
1950 - 1959 |
1960 - 1969 |
1970 - 1979 |
1980 - 1989 |
1990 - 1999 |
2000 - 2009 |
2010 or later |
||
|---|---|---|---|---|---|---|---|---|---|---|---|---|
| 2009 | 94,239 | 3,350 | 9,669 | 20,329 | 17,529 | 15,094 | 4,058 | 11,642 | 6,975 | 8,943 | 0 | |
| 2010 | 95,171 | 3,519 | 9,655 | 20.266 | 17,445 | 15,130 | 4,058 | 11,728 | 6,976 | 9,880 | 33 | |
| 2011 | 78,143 | 5,497 | 8,649 | 15,520 | 14,054 | 11,610 | 3,300 | 10,003 | 5,001 | 9,734 | 272 | |
| 2012 | 76,800 | 2,721 | 8,588 | 15,100 | 13,254 | 10,0236 | 3,777 | 9,050 | 4,431 | 11,991 | 573 | |
| 2013 | 78,207 | 1,597 | 8,539 | 15,052 | 13,185 | 10,031 | 3,774 | 9,076 | 4,570 | 12,345 | 1,635 |
Number of Bedrooms
Variable: BedCountACS
Population: Residential properties with a building
Weights: Values were weighted base on number of units
Class: Factor
Frequency Table:
| Weighted N | Missing | 0** | 1 | 2 | 3 | 4 | 5 or more | ||
|---|---|---|---|---|---|---|---|---|---|
| 2009 | 51,271 | 46,318 | 0 | 10,720 | 17,222 | 15,505 | 5,540 | 2,284 | |
| 2010 | 51,972 | 46,718 | 0 | 11,020 | 17,286 | 15,632 | 5,520 | 2,514 | |
| 2011 | 52,908 | 30,732 | 0 | 10,977 | 17,268 | 16,117 | 5,787 | 2,759 | |
| 2012 | 52,933 | 26,588 | 0 | 10,936 | 17,188 | 15,854 | 5,997 | 2,958 | |
| 2013 | 53,571 | 26,263 | 0 | 10,930 | 17,113 | 16,032 | 6,286 | 3,180 |
** There is no way to pinpoint 0 bedrooms in the data.
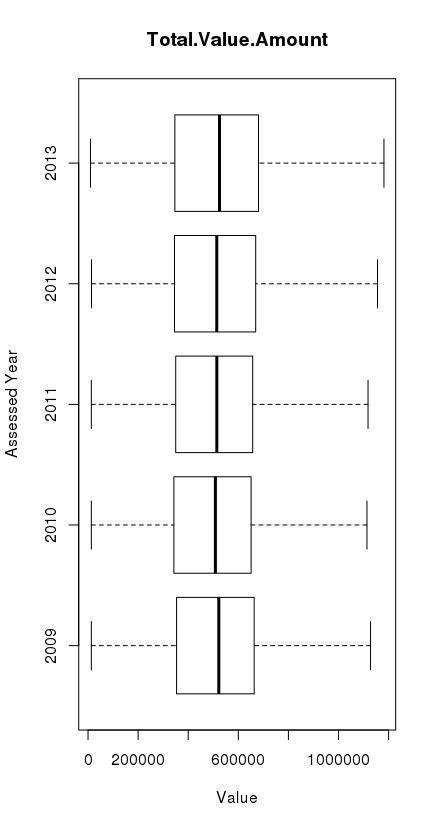
Total Value
Variable: TOTAL.VALUE.CALCULATED
Years: 2009-2013
Population: Residential properties with a building - owner occupied
Exclusion: Removed those classified as multifamily, unknown, and renter occupied (Renters do not get asked real estate tax questions)
N: See table at top of page
Number missing: 0
Class: Numeric
Range: 9,700 – 32,291,800
Standard Deviation: 324,959
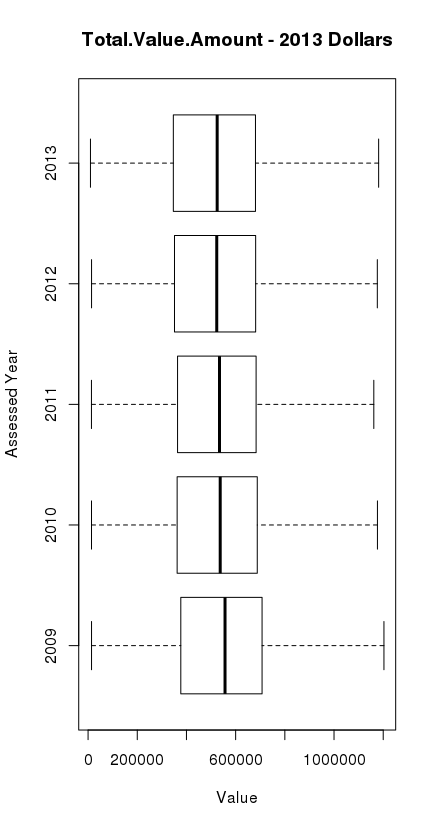
Total Value in Constant 2013 Dollars
Variable: Total.Value.Amount.Constant2013
Years: 2009-2013
Population: Residential properties with a building - owner occupied
Exclusion: Removed those classified as multifamily, unknown, and renter occupied (Renters do not get asked real estate tax questions)
N: See table at top of page
Number missing: 0
Class: Numeric
Range: 9700 – 34,440,494
Standard Deviation: 336,460
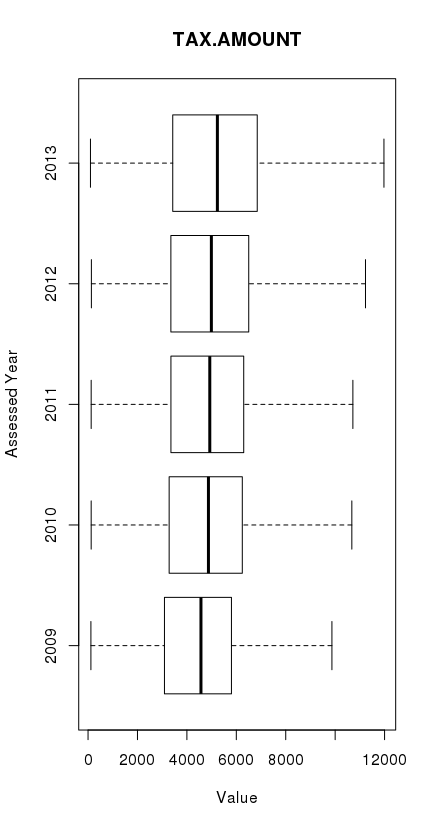
Taxes Paid
Variable: TAX.AMOUNT
Years: 2009-2014
Population: Residential properties with a building - owner occupied
Exclusion: Removed those classified as multifamily, unknown, and renter occupied (Renters do not get asked real estate tax questions)
N: See table at top of page
Number missing: 1,031
Class: Numeric
Range: 97.58 — 156,328
Standard Deviation: 2,738
Taxes Paid in Constant 2013 dollars
Variable: TAX.AMOUNT.2013
Years: 2009-2014
Population: Residential properties with a building - owner occupied
Exclusion: Removed those classified as multifamily, unknown, and renter occupied (Renters do not get asked real estate tax questions)
N: See table at top of page
Number missing: 42,417
Class: Numeric
Range: 97.58 – 16619.52
Standard Deviation: 2,821.42
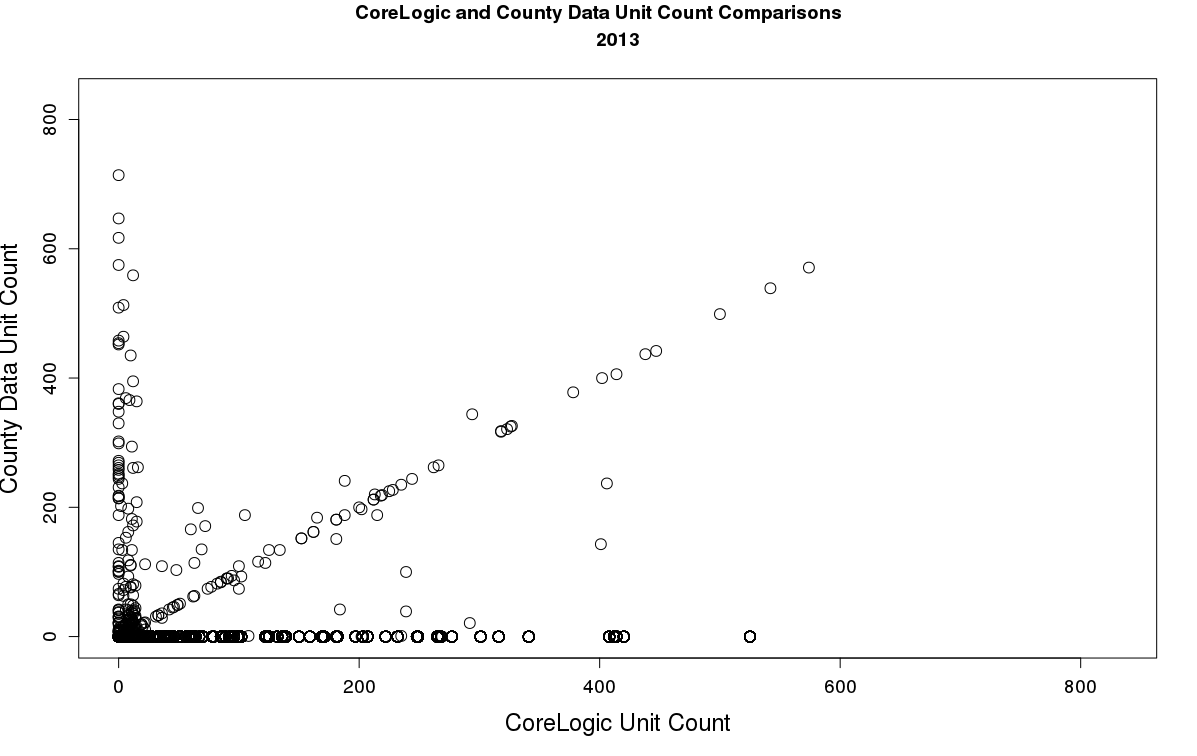
Unit Counts