This page makes comparisons External Data to the County Data.
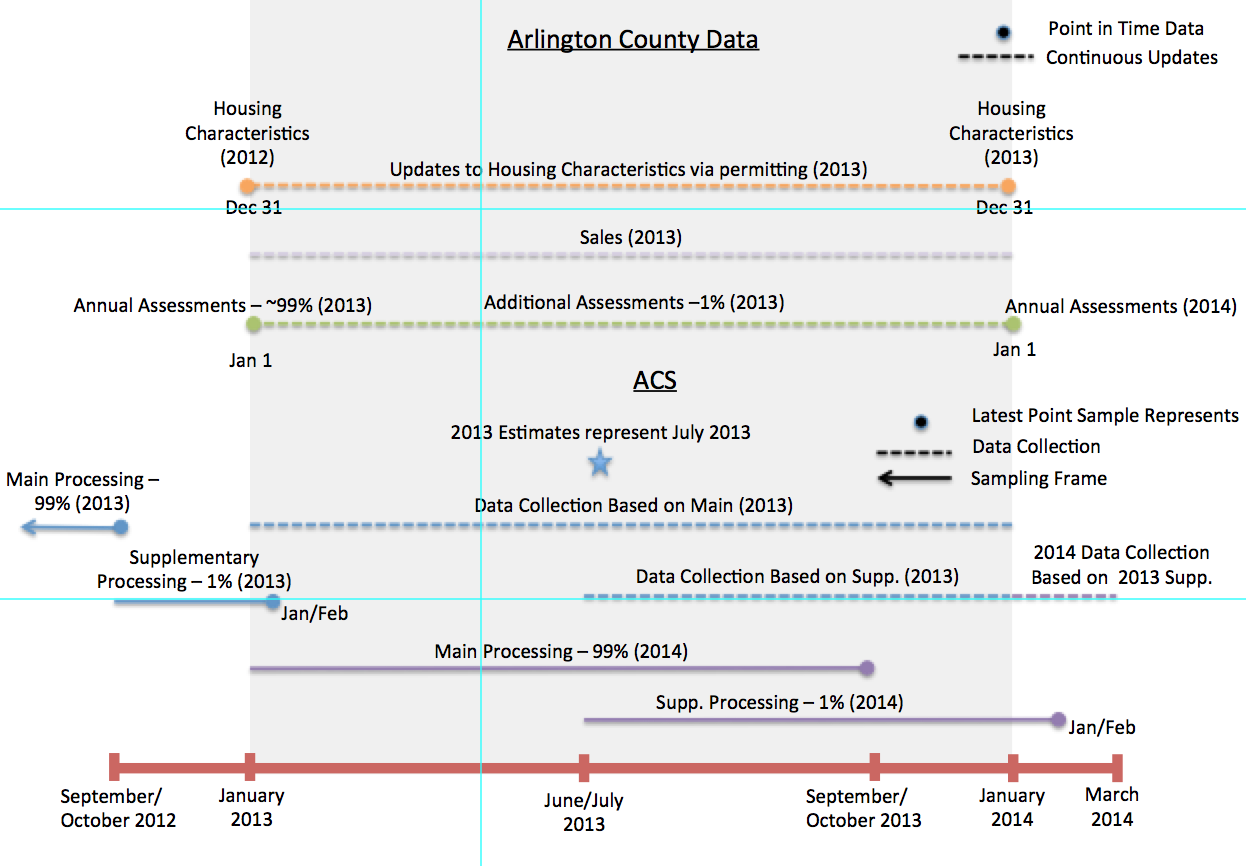
Data Sampling Frame and Data Collection
For its main sample processing, the Census selects addresses form its a Master Address Files (MAF). "The MAF is updated twice each year with the Delivery Sequence Files (DSF) provided by the U.S. Postal Service. The DSF covers only the U.S. These files identify mail drop points and provide the best available source of changes and updates to the housing unit inventory. The MAF is also updated with the results from various Census Bureau field operations, including the ACS." The file is received September/October of the previous year and accounts for 99% of that year's sample. – American Community Survey Design and Methodology (January 2014)
The MAF is updated a second time in January/February of the sample year and a second/supplementary sample is created. "All addresses that were in a first-phase sample within the past four years are excluded from eligibility. This ensures that no address is in sample more than once in any five-year period. The second step is to select a 20 percent systematic sample of 'new' units, i.e. those units that have never appeared on a previous MAF extract. Each new address is systematically assigned to either the current year or to one of four backsamples. This procedure maintains five equal partitions (samples) of the universe." – American Community Survey Design and Methodology (January 2014)
The figure below compares the years covered by ACS Sampling and Data Collection for 2013 to the years covered by Arlington County's Data Collection for 2013.
Rate of Change
There are several ways to see how fast housing characteristics and total counts within the county. One way is to see how many housing units were listed in the Arlington County data as being built that year (see table below). However, this is not perfect as often a housing unit is listed with an NA the year is is built. Thus, we looked at the number of units listed to be built the year after (e.g. 2009 in 2010 data).
| 2009 | 2010 | 2011 | 2012 | 2013 | |
|---|---|---|---|---|---|
| Housing Units Built each Year | 6 | 28 | 1 | 92 | 10 |
| Housing Units Built each Year (using the next year's data) | 11 | 289 | 308 | 1,017 | -- |
Using MRIS-MLS data, we looked at how many houses where sold each year with a year built listed as the same year — new homes being sold on the open market.
| 2009 | 2010 | 2011 | 2012 | 2013 | |
|---|---|---|---|---|---|
| New Homes Sold via MRIS | 88 | 70 | 62 | 77 | 87 |
Lastly, another way to to look at the rate of change is to look at the permitting data so see how many permits were taken out for new bedrooms, new construction, etc. This is left for future research.
Data Transforming Process
The unit of observation for CoreLogic, BlackKnight, and AC data is the parcel. The unit of observation for ACS is a housing unit. Thus, we had to take steps to transform the data to residential parcels that have a building on them. The table below describes the steps and the results for County Data and BlackKnight.
2009
| AC | BKFS | ||
|---|---|---|---|
| Original N | 64,827 | 64,827 | |
| Justification | Step taken | ||
| Residential Only | Recode Land Use codes and select Residential Parcels* | 62,213 | 62,213 |
| No Buildings/Vacant Land | Remove the parcels with zero Assessed Improvement Value | -- | 0 |
| Remove those with a "VAC" (Vacant) Code under extension | 60,485 | -- | |
| Remove common areas | 60,485 | -- | |
| Parking Lots | Remove the parcels with zero Assessed Land Value | 60,283 | |
| Remaining Vacant Land** | Select the parcels with Assessed Land Value greater than 15,000 | -- | |
| Non-Arlington Properties | Remove multi-jurisdictions Properties | 60,261 | -- |
| Final N | 60,261 | 0 |
2010
| AC | BKFS | ||
|---|---|---|---|
| Original N | 65,201 | 65,201 | |
| Justification | Step taken | ||
| Residential Only | Recode Land Use codes and select Residential Parcels* | 62,608 | 62,608 |
| No Buildings/Vacant Land | Remove the parcels with zero Assessed Improvement Value | -- | 0 |
| Remove those with a "VAC" (Vacant) Code under extension | 60,933 | -- | |
| Remove common areas | 60,933 | -- | |
| Parking Lots | Remove the parcels with zero Assessed Land Value | 60,225 | 0 |
| Remaining Vacant Land** | Select the parcels with Assessed Land Value greater than 15,000 | -- | 0 |
| Non-Arlington Properties | Remove multi-jurisdictions Properties | 60,203 | -- |
| Final N | 60,203 | 0 |
2011
| AC | BKFS | ||
|---|---|---|---|
| Original N | 65,242 | 65,264 | |
| Justification | Step taken | ||
| Residential Only | Recode Land Use codes and select Residential Parcels* | 62,644 | 62,663 |
| No Buildings/Vacant Land | Remove the parcels with zero Assessed Improvement Value | -- | 0 |
| Remove those with a "VAC" (Vacant) Code under extension | 61,130 | -- | |
| Remove common areas | 61,130 | -- | |
| Parking Lots | Remove the parcels with zero Assessed Land Value | 60,487 | 0 |
| Remaining Vacant Land** | Select the parcels with Assessed Land Value greater than 15,000 | -- | 0 |
| Non-Arlington Properties | Remove multi-jurisdictions Properties | 60,465 | -- |
| Final N | 60,465 | 0 |
2012
| AC | BKFS | ||
|---|---|---|---|
| Original N | 65,364 | 65,364 | |
| Justification | Step taken | ||
| Residential Only | Recode Land Use codes and select Residential Parcels* | 62,778 | 62,778 |
| No Buildings/Vacant Land | Remove the parcels with zero Assessed Improvement Value | -- | 0 |
| Remove those with a "VAC" (Vacant) Code under extension | 61,284 | -- | |
| Remove common areas | 61,284 | -- | |
| Parking Lots | Remove the parcels with zero Assessed Land Value | 60,710 | 0 |
| Remaining Vacant Land** | Select the parcels with Assessed Land Value greater than 15,000 | -- | 0 |
| Non-Arlington Properties | Remove multi-jurisdictions Properties | 60,688 | -- |
| Final N | 60,688 | 0 |
2013
| AC | BKFS | ||
|---|---|---|---|
| Original N | 65,433 | 65,443 | |
| Justification | Step taken | ||
| Residential Only | Recode Land Use codes and select Residential Parcels* | 62,847 | 62,847 |
| No Buildings/Vacant Land | Remove the parcels with zero Assessed Improvement Value | -- | 61,174 |
| Remove those with a "VAC" (Vacant) Code under extension | 62,049 | -- | |
| Remove common areas | 62,049 | -- | |
| Parking Lots | Remove the parcels with zero Assessed Land Value | 60,988 | 60,592 |
| Remaining Vacant Land** | Select the parcels with Assessed Land Value greater than 15,000 | -- | 60,413 |
| Non-Arlington Properties | Remove multi-jurisdictions Properties | 60,966 | -- |
| Final N | 60,966 | 60,413 |
* "Condo", "Single Family - Detached", "Single Family - Attached", "Multifamily","Unknown Affordable Dwelling Unit", "MixedUsed"
** This was done as there was not vacant land or common area codes. Some vacant land/common areas do have minimal improvement value.
Fitness for Use
With knowledge of the data, it became possible to identify which of the various ACS tables we would have confidence in (or not in) comparing with the external data.
Arlington County Data
- The best:
- Owner occupied tables (e.g. value): The county data does not include whether a single family residence is being rented out, the county data over estimates these tables. The size of this overestimation depends on the rental market for single families.
- Property Information (e.g. year built; number of units) for all housing units: The county data can be weighted by number of units to better match the ACS estimates.
- The worst:
- Heating Fuel: Where the ACS looks at heating fuel, the AC data looked at heating type (e.g. forced hot air). Not all heating types listed could be placed within an ACS bin.
- Bedroom Count: Where the ACS includes all housing units, the county data only has bedroom information for multifamily.
- Plumbing Facilities: Where the ACS defines this having at least a full bathroom and a kitchen, it was only possible to define this as having at least a full bathroom.
BKFS Data
- The best:
- Tenure and by Tenure (depending on other variable): BKFS does impute a variable on whether a property is rented or not.
- Property Information (e.g. year built; number of units) for all housing units: The county data can be weighted by number of units to better match the ACS estimates.
- The worst:
- Bedroom Count: Where the ACS includes all housing units, the BKFS data only has bedroom information for multifamily.
- Plumbing Facilities: Where the ACS defines this having at least a full bathroom and a kitchen, it was only possible to define this as having at least a full bathroom.
Weighting/Number of Units
Due to the external data's unit of observation (the parcel), we need to weight multifamily units by the number of units in the structure. For example, if an apartment building as 50 apartments, the ACS views each apartment as its own separate housing unit, each has a potential to be sampled, and the estimates are created as if each are a separate observations. In the external data, the same multifamily would only be in the data once. Because the significant role these weights play, it is necessary to examine if difference in weights are creating the observed differences in benchmarking.
| Year | N (Multifamily) | N (Multifamily with a Unit Count > 1) | Min Number of Units | Max Number of Units | Mean | SD | ||
|---|---|---|---|---|---|---|---|---|
| AC | 2013 | 770 | 359 | 1 | 1327 | 120 | 160 | |
| BKFS | 2013 | 570 | 345 | 1 | 3085 | 91 | 207 | |
| ATRACK | 2015 | 412 | 410 | 1 | 1318 | 121 | 175 |
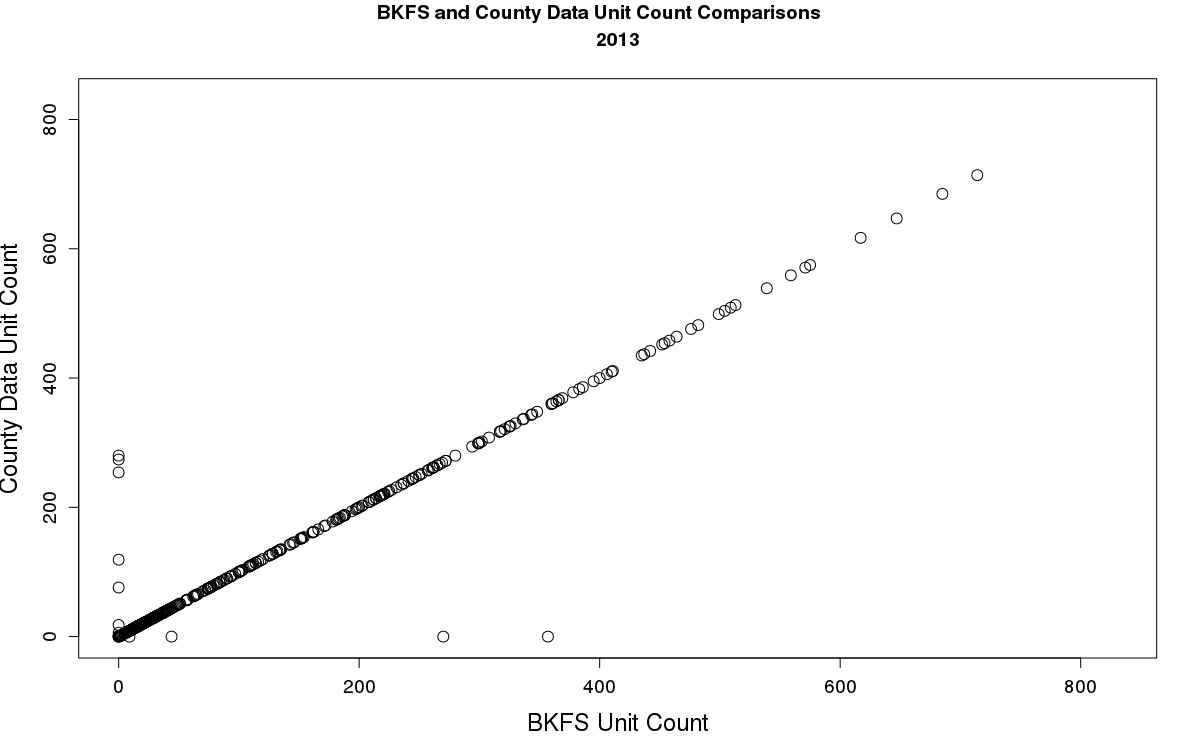
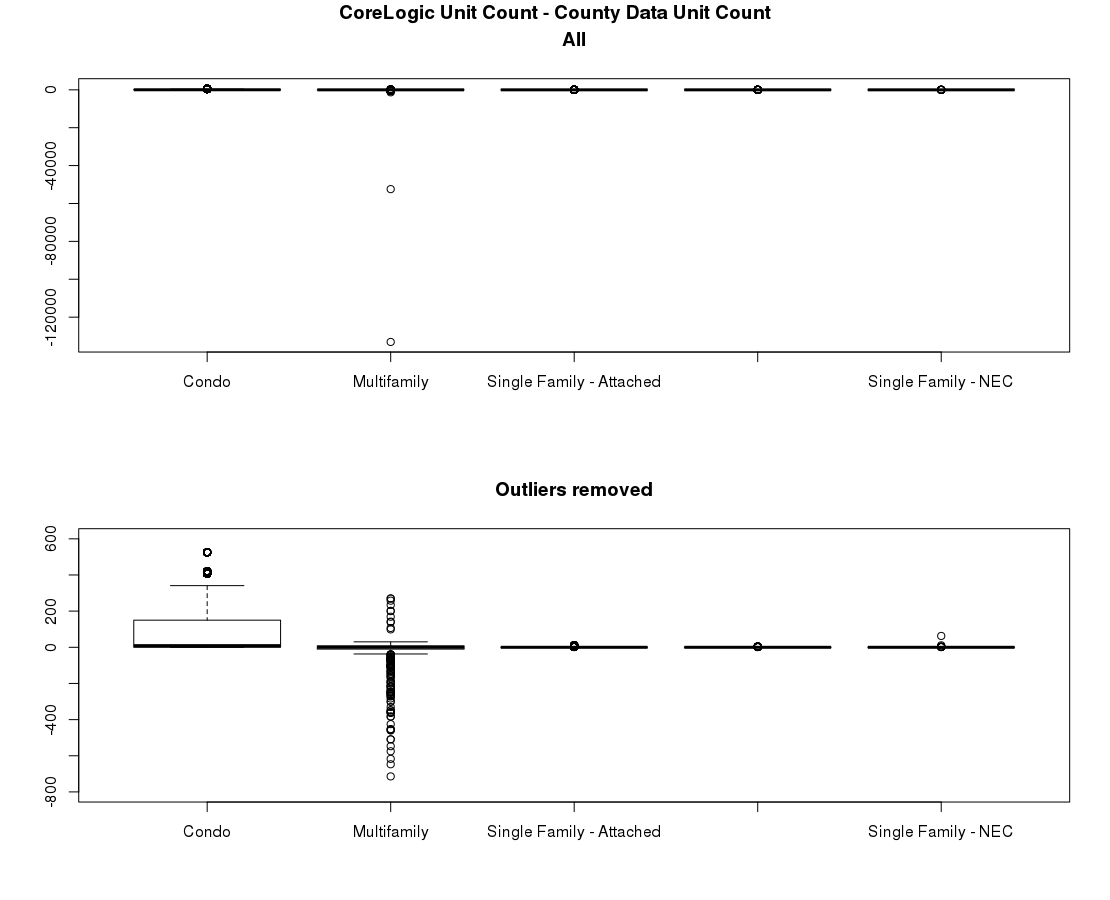
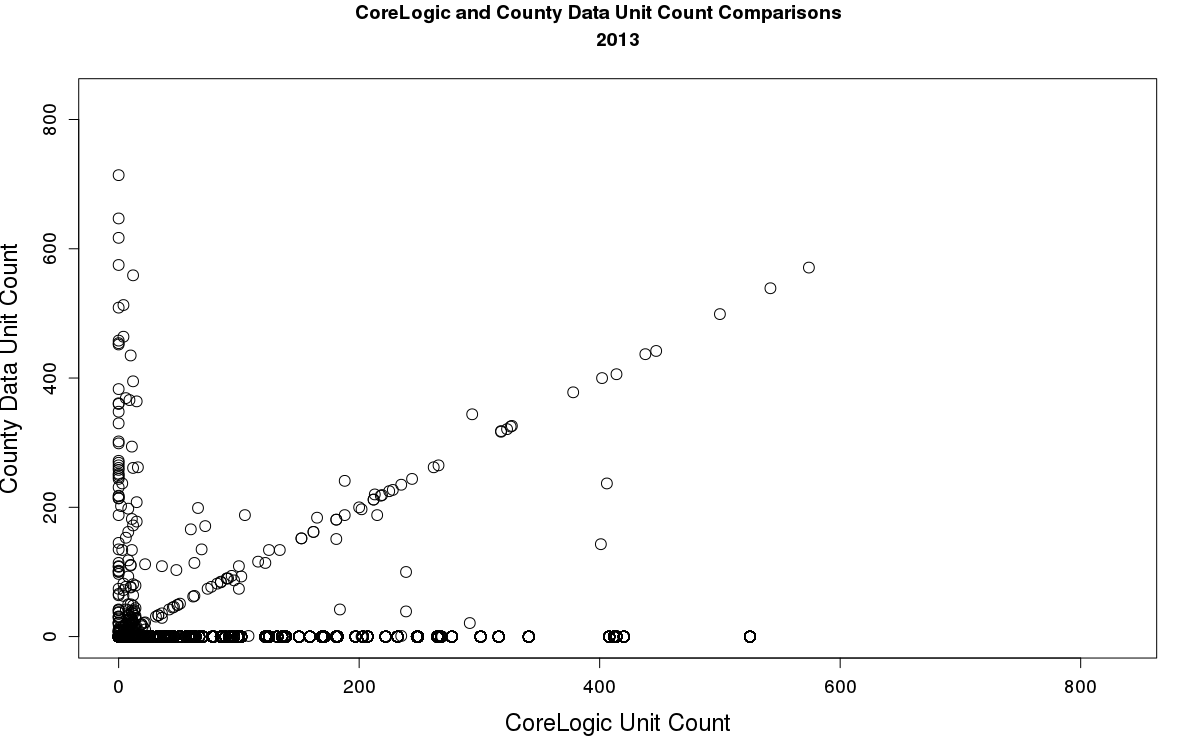
Matrix of matching unit counts
Of the shared parcels, cells indicate percentage of counts of row (data source) that are the same.
| AC | BKFS | ATRACK | |
|---|---|---|---|
| AC | 100% | ||
| BKFS | 99% | 100% | |
| ATRACK | 66% | 66% | 100% |
Of the shared parcels, cells indicate percentage of counts of row (data source) that are less than 10 units different.
| AC | BKFS | ATRACK | |
|---|---|---|---|
| AC | 100% | ||
| BKFS | 99% | 100% | |
| ATRACK | 83% | 83%% | 100% |
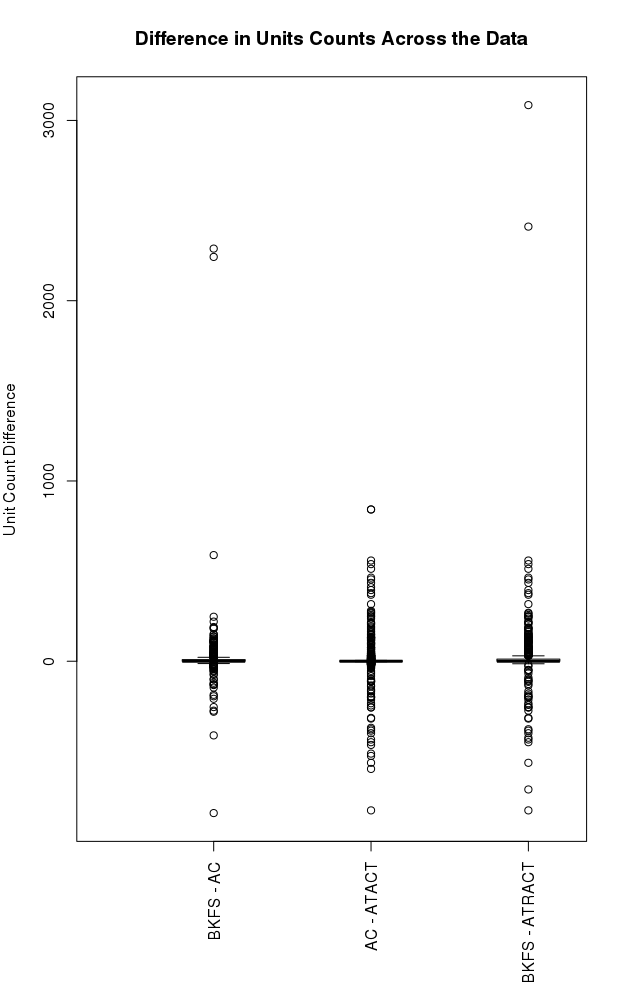
Note: Figure includes all parcels listed as multifamily with a unit count greater than 0. If a parcel is not list in a dataset, then its unit count is changed to 0.
Two parcels are accounting for this difference. (Parcels are not in ATRACT)
| APN | BKFS Unit Count | AC Unit Count | diff |
|---|---|---|---|
| 38011004 | 3,085 | 842 | 2,243 |
| 22001724 | 2,411 | 122 | 2,289 |
| Total | 4,532 |
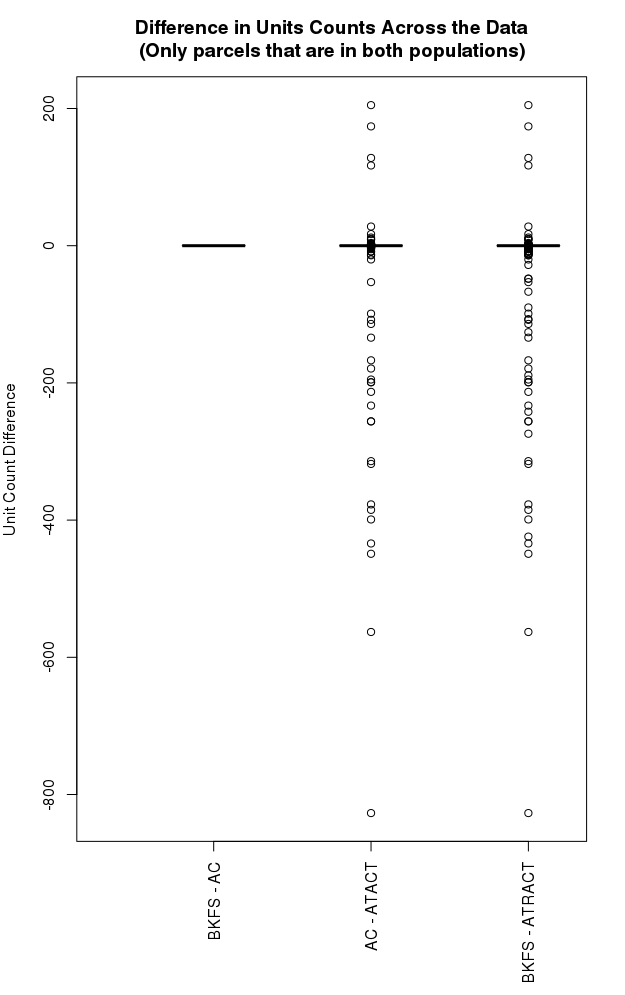
When excluding these two outliers and then looking at the rows that are in both populations, the unit counts become clear. The difference in ATRACK comes from two difference sources. The ATRACK unit count being significant higher than both AC and BKFS (this could be due to growth in the apartment units between 2010 to 2015.... no way of knowing though.) Where ATRACK has a unit count but both AC and BKFS as the unit count as 1.
Selling Price (MRIS to Assessments)
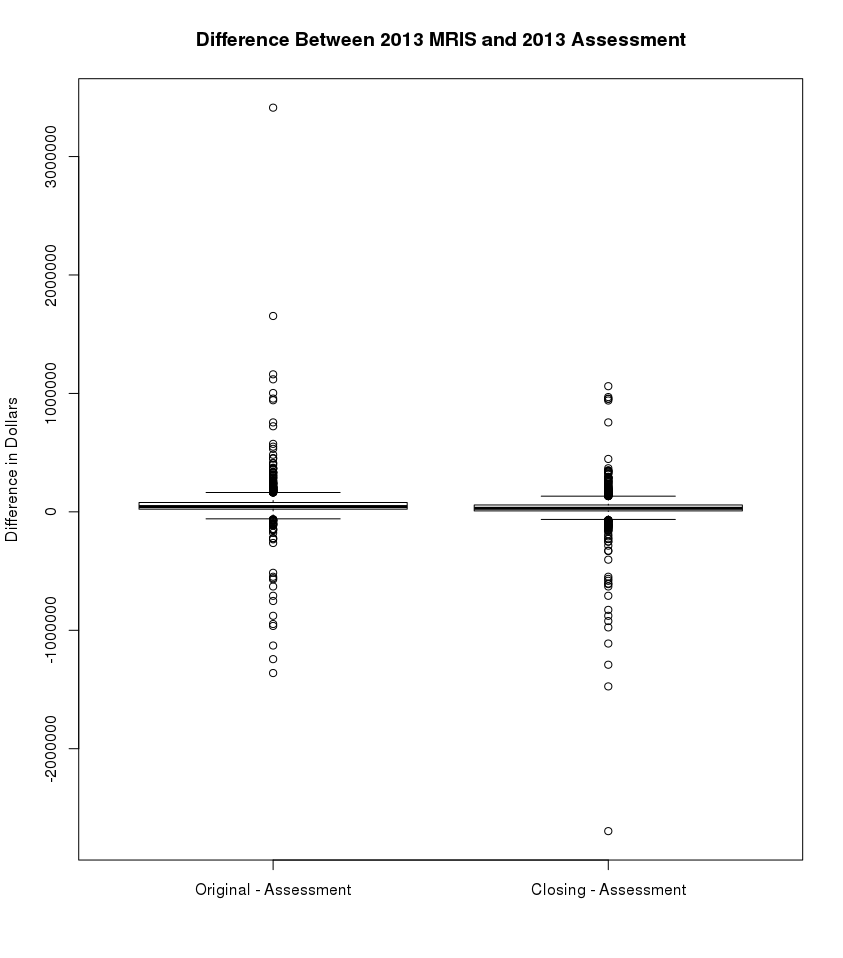
Difference between listing price and assessment
- Median: $44,400
Difference between selling price and assessment
- Median: $29,900
Variable Comparisons
Housing Type
Year | Data | N | Missing | Condo | MultiFamily | Single Family-Attached | Single Family Detached | Unknown Affordable Dwelling Unit | |
|---|---|---|---|---|---|---|---|---|---|
| 2013 | BKFS | 60,413 | 0 | 26,002 | 570 | 6,005 | 27,477 | 89 | |
| County | 60,991 | 0 | 26,321 | 771 | 6,292 | 27,518 | 89 |
Year | Data | Weighted N | Missing | Condo | MultiFamily | Single Family-Attached | Single Family Detached | Unknown Affordable Dwelling Unit | |
|---|---|---|---|---|---|---|---|---|---|
| 2013 | BKFS | 110,883 | 0 | 26,002 | 50,955 | 6,023 | 27,544 | 89 | |
| County | 103,987 | 0 | 26,321 | 43,496 | 6,292 | 27,518 | 89 |
Number of Units
Year | Data | N | Missing | 1-Attached | 1-Detached | 2 | 3 or 4 units | 5 to 9 units | 10 to 19 units | 20 to 49 units | 50 or more Units | Unknown | |
|---|---|---|---|---|---|---|---|---|---|---|---|---|---|
| 2013 | BKFS | 60,413 | 0 | 32,007 | 27,477 | 1 | 19 | 127 | 100 | 102 | 196 | 384 | |
| County | 60,468 | 523 | 6,024 | 27,518 | 271 | 9 | 124 | 578 | 2,229 | 23,775 | 463 |
Year | Data | Weighted N | Missing | 1-Attached | 1-Detached | 2 | 3 or 4 units | 5 to 9 units | 10 to 19 units | 20 to 49 units | 50 or more Units | Unknown | |
|---|---|---|---|---|---|---|---|---|---|---|---|---|---|
| 2013 | BKFS | 110,883 | 0 | 32,025 | 27,544 | 2 | 75 | 962 | 1,320 | 3,215 | 45,356 | 384 | |
| County | 103,987 | 0 | 6,024 | 27,518 | 542 | 12 | 334 | 1,220 | 4,635 | 63,239 | 463 |
Year Built
Year | Data | N | Missing | 1939 or earlier | 1940 - 1949 | 1950 - 1959 | 1960 - 1969 | 1970 - 1979 | 1980 - 1989 | 1990 - 1999 | 2000 - 2009 | 2010 or later | |
|---|---|---|---|---|---|---|---|---|---|---|---|---|---|
| 2013 | BKFS | 60,413 | 26,142 | 7,664 | 8,346 | 8,180 | 2,293 | 1,309 | 2,277 | 1,650 | 1,974 | 578 | |
| County | 60,511 | 480 | 8,831 | 13,741 | 11,352 | 5,033 | 2,872 | 6,711 | 3,243 | 8,416 | 459 |
Year | Data | Weighted N | Missing | 1939 or earlier | 1940 - 1949 | 1950 - 1959 | 1960 - 1969 | 1970 - 1979 | 1980 - 1989 | 1990 - 1999 | 2000 - 2009 | 2010 or later | |
|---|---|---|---|---|---|---|---|---|---|---|---|---|---|
| 2013 | BKFS | 80,877 | 30,006 | 9,261 | 16,852 | 15,071 | 10,592 | 2,560 | 7,145 | 4,545 | 10,608 | 4,243 | |
| County | 97,365 | 6,622 | 9,495 | 18,267 | 16,403 | 13,560 | 4,112 | 11,726 | 6,015 | 15,952 | 1,835 |