Geography
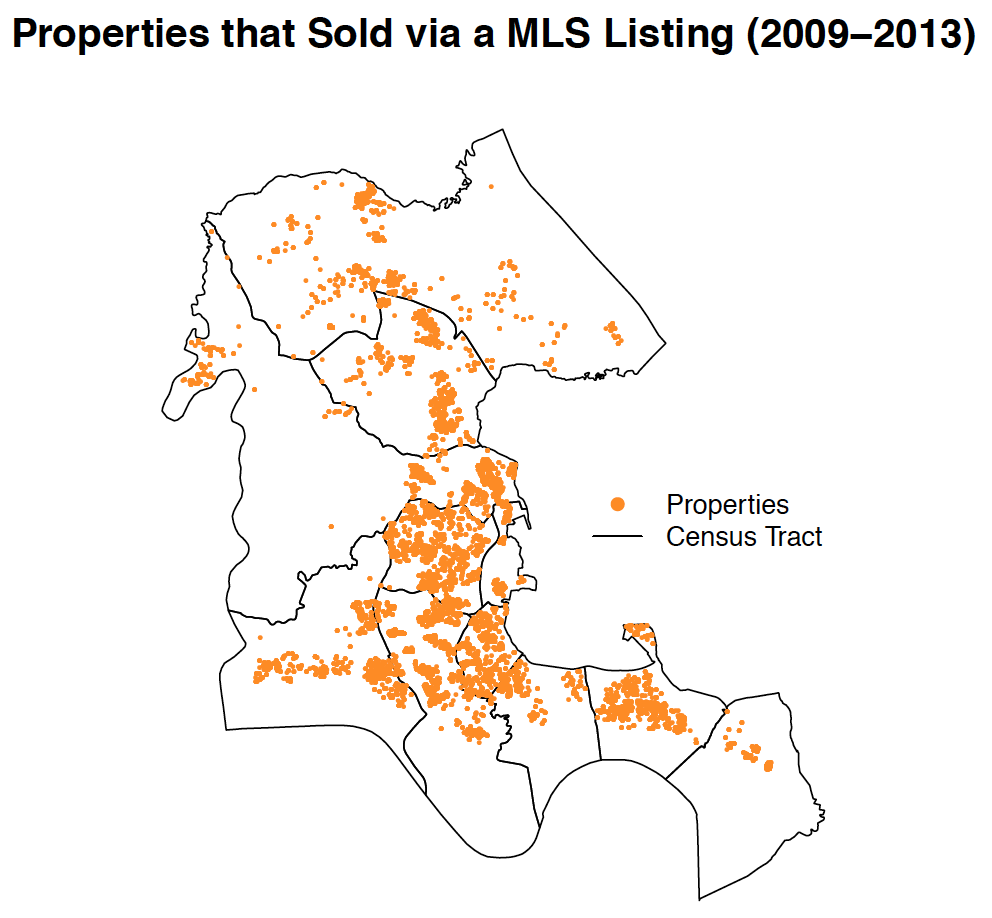
N: 4,350
N:
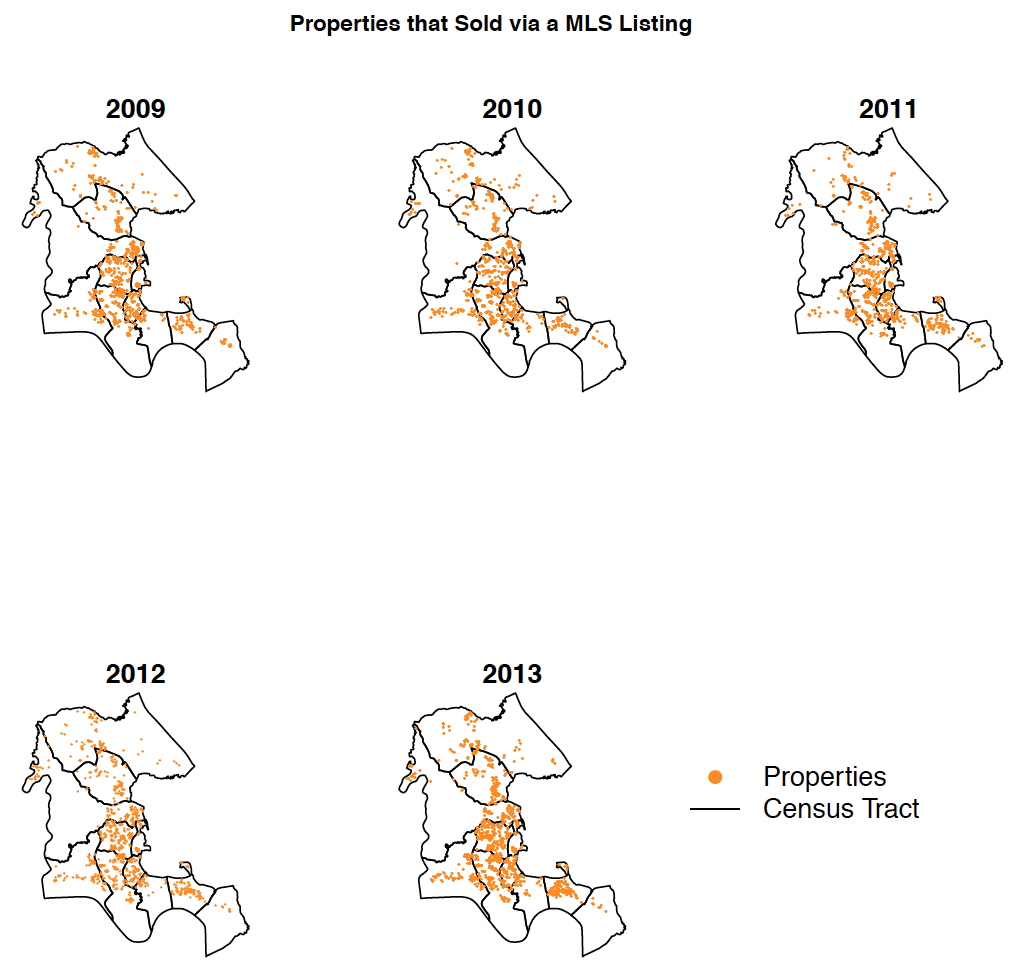
Year | N |
|---|---|
| 2009 | 783 |
2010 | 758 |
| 2011 | 758 |
| 2012 | 936 |
| 2013 | 1,144 |
WMLS to ACS
Is the MRIS data different than the ACS estimates?
Note: The Null hypothesis with these chi-square tests is that the observed (WMLS) values are not different than the expected (ACS).
Result: The WMLS do appear to be different than the AC Real Estate Data .
Bedrooms
| Year | X2 | DF | p-value |
|---|---|---|---|
| 2013 | 113.14 | 5 | <0.000 |
Year Built
| Year | X2 | DF | p-value |
|---|---|---|---|
| 2013 | 1,897.4 | 8 | <0.000 |
NOTE: We cannot compare WMLS to PUMS sample as the data only represent a portion of the JCC PUMA.