VT Census Case Studies : ACS Benchmarking B25034 - Year Structure Built (ACREA)
Created and last modified by molfe on 04 Jan 2016
Notes:
- Bolded: ACS 90% MOE crosses 0 (no data still with MOE)
- Year Built used is a combination of dwelling year built and property year built to account for different year built in multiple dwellings
- Arlington County data is weighted by the number of units within the property.
- Not all properties have a units counts, which drives the number of housing units down (especially when the NA is for a multifamily).
- Number of unknown units count: 206 (2009), 233 (2010), 237 (2011), 248 (2012) and 463 (2013)
- The total estimates below do not include those with an NA value (which are weighted). The % NA are based on the total estimate with NA values.
- All prepared Arlington County data are used in the tabulations. When calculating census tract and block group (bg) comparisons, only those data that are within a designated tract/bg are included. When geocoding addresses along the county boarder, rooftop coordinates can occur outside the county. When merging tract to coordinates, these properties would not receive a tract/BG ID number
5 Year
| Geography: | Arlington County, Virginia |
|---|
| Dataset: 2009-2013 5-year | B25034 YEAR STRUCTURE BUILT [Universe: Housing units] |
|---|
| Description of Variable | ACS Benchmark | Direct Estimate from Arlington County Real Estate |
|---|
| Estimate | 90%MOE | SE | Estimate | Difference | Within 90%MOE? |
|---|
| Total | 106,740 | 191 | 116 | 100,233 | 6,507 | NO |
|---|
| Built 2010 or later | 1,259 | 222 | 135 | 5,067 | -3,808 | NO |
|---|
| Built 2000 to 2009 | 16,900 | 759 | 461 | 14,527 | 2,373 | NO |
|---|
| Built 1990 to 1999 | 9,770 | 722 | 439 | 8,748 | 1,022 | NO |
|---|
| Built 1980 to 1989 | 12,016 | 639 | 388 | 11,182 | 834 | NO |
|---|
| Built 1970 to 1979 | 11,388 | 772 | 469 | 6,497 | 4,891 | NO |
|---|
| Built 1960 to 1969 | 12,425 | 776 | 472 | 14,941 | -2,516 | NO |
|---|
| Built 1950 to 1959 | 16,769 | 828 | 503 | 15,661 | 1,108 | NO |
|---|
| Built 1940 to 1949 | 16,609 | 724 | 440 | 16,628 | -19 | YES |
|---|
| Built 1939 or earlier | 9,604 | 498 | 303 | 6,067 | 3,537 | NO |
|---|
1 Year
| Geography: | Arlington County, Virginia |
|---|
| Dataset: 2009 1-year | B25034 YEAR STRUCTURE BUILT [Universe: Housing units] |
|---|
| Description of Variable | ACS Benchmark | Direct Estimate from Arlington County Real Estate |
|---|
| Estimate | 90%MOE | SE | Estimate | Difference | Within 90%MOE? |
|---|
| Total | 103,813 | 872 | 530 | 99,595 | 4,218 | NO |
|---|
| Built 2005 or later | 5,513 | 1,158 | 704 | 7,207 | -1,694 | NO |
|---|
| Built 2000 to 2004 | 9,154 | 1,724 | 1,048 | 5,916 | 3,238 | NO |
|---|
| Built 1990 to 1999 | 8,675 | 1,290 | 784 | 7,375 | 1,300 | NO |
|---|
| Built 1980 to 1989 | 12,107 | 1,855 | 1,128 | 11,899 | 208 | YES |
|---|
| Built 1970 to 1979 | 10,771 | 1,687 | 1,026 | 4,122 | 6,649 | NO |
|---|
| Built 1960 to 1969 | 12,237 | 1,515 | 921 | 15,993 | -3,756 | NO |
|---|
| Built 1950 to 1959 | 18,725 | 2,117 | 1,287 | 17,084 | 1,641 | YES |
|---|
| Built 1940 to 1949 | 18,178 | 2,068 | 1,257 | 20,440 | -2,262 | NO |
|---|
| Built 1939 or earlier | 8,453 | 1,177 | 716 | 9,559 | -1,106 | YES |
|---|
| NA | | | | 1,396 | | |
|---|
| Geography: | Arlington County, Virginia |
|---|
| Dataset: 2010 1-year | B25034 YEAR STRUCTURE BUILT [Universe: Housing units] |
|---|
| Description of Variable | ACS Benchmark | Direct Estimate from Arlington County Real Estate |
|---|
| Estimate | 90%MOE | SE | Estimate | Difference | Within 90%MOE? |
|---|
| Total | 105,490 | 619 | 376 | 101,025 | 4,465 | NO |
|---|
| Built 2005 or later | 8,435 | 1,398 | 850 | 8,386 | 49 | YES |
|---|
| Built 2000 to 2004 | 8,960 | 1,802 | 1,095 | 5,915 | 3,045 | NO |
|---|
| Built 1990 to 1999 | 8,483 | 1,314 | 799 | 1,372 | 7,111 | NO |
|---|
| Built 1980 to 1989 | 13,431 | 1,719 | 1,045 | 11,988 | 1,443 | YES |
|---|
| Built 1970 to 1979 | 9,683 | 1,620 | 985 | 4,125 | 5,558 | NO |
|---|
| Built 1960 to 1969 | 13,096 | 1,757 | 1,068 | 16,151 | -3,055 | NO |
|---|
| Built 1950 to 1959 | 18,012 | 2,205 | 1,340 | 17,061 | 951 | YES |
|---|
| Built 1940 to 1949 | 16,986 | 1,676 | 1,019 | 20,421 | -3,435 | NO |
|---|
| Built 1939 or earlier | 8,404 | 1,190 | 723 | 9,606 | -1,202 | NO |
|---|
| NA | | | | 842 | | |
|---|
| Geography: | Arlington County, Virginia |
|---|
| Dataset: 2011 1-year | B25034 YEAR STRUCTURE BUILT [Universe: Housing units] |
|---|
| Description of Variable | ACS Benchmark | Direct Estimate from Arlington County Real Estate |
|---|
| Estimate | 90%MOE | SE | Estimate | Difference | Within 90%MOE? |
|---|
| Total | 106,720 | 417 | 253 | 101,489 | 5,231 | NO |
|---|
| Built 2005 or later | 10,099 | 2,297 | 1,396 | 8,892 | 1,207 | YES |
|---|
| Built 2000 to 2004 | 10,233 | 2,200 | 1,337 | 5,886 | 4,347 | NO |
|---|
| Built 1990 to 1999 | 10,232 | 2,434 | 1,480 | 17,082 | -6,850 | NO |
|---|
| Built 1980 to 1989 | 10,915 | 2,511 | 1,526 | 16,170 | -5,255 | NO |
|---|
| Built 1970 to 1979 | 11,385 | 1,939 | 1,179 | 4,126 | 7,259 | NO |
|---|
| Built 1960 to 1969 | 12,647 | 2,882 | 1,752 | 11,904 | 743 | YES |
|---|
| Built 1950 to 1959 | 15,628 | 2,113 | 1,284 | 7,375 | 8,253 | NO |
|---|
| Built 1940 to 1949 | 15,351 | 1,832 | 1,114 | 14,566 | 785 | YES |
|---|
| Built 1939 or earlier | 10,230 | 1,450 | 881 | 212 | 10,018 | NO |
|---|
| NA | | | | 810 | | |
|---|
| Geography: | Arlington County, Virginia |
|---|
| Dataset: 2012 1-year | B25034 YEAR STRUCTURE BUILT [Universe: Housing units] |
|---|
| Description of Variable | ACS Benchmark | Direct Estimate from Arlington County Real Estate |
|---|
| Estimate | 90%MOE | SE | Estimate | Difference | Within 90%MOE? |
|---|
| Total | 107,734 | 537 | 326 | 101,731 | 6,003 | NO |
|---|
| Built 2010 or later | 1,609 | 455 | 277 | 735 | 874 | NO |
|---|
| Built 2000 to 2009 | 16,501 | 1,909 | 1,160 | 14,599 | 1,902 | YES |
|---|
| Built 1990 to 1999 | 9,831 | 1,392 | 846 | 7,374 | 2,457 | NO |
|---|
| Built 1980 to 1989 | 12,709 | 1,907 | 1,159 | 11,906 | 803 | YES |
|---|
| Built 1970 to 1979 | 11,609 | 1,613 | 981 | 4,128 | 7,481 | NO |
|---|
| Built 1960 to 1969 | 11,219 | 1,738 | 1,057 | 16,007 | -4,788 | NO |
|---|
| Built 1950 to 1959 | 16,465 | 1,669 | 1,015 | 17,028 | -563 | YES |
|---|
| Built 1940 to 1949 | 17,375 | 1,510 | 918 | 20,328 | -2,953 | NO |
|---|
| Built 1939 or earlier | 10,416 | 1,376 | 836 | 9,626 | 790 | YES |
|---|
| NA | | | | 780 | | |
|---|
| Geography: | Arlington County, Virginia |
|---|
| Dataset: 2013 1-year | B25034 YEAR STRUCTURE BUILT [Universe: Housing units] |
|---|
| Description of Variable | ACS Benchmark | Direct Estimate from Arlington County Real Estate |
|---|
| Estimate | 90%MOE | SE | Estimate | Difference | Within 90%MOE? |
|---|
| Total | 109,689 | 504 | 306 | 97,325 | 12,364 | NO |
|---|
| Built 2010 or later | 3,849 | 973 | 591 | 1,835 | 2,014 | NO |
|---|
| Built 2000 to 2009 | 17,968 | 1,893 | 1,151 | 15,952 | 2,016 | NO |
|---|
| Built 1990 to 1999 | 12,041 | 1,596 | 970 | 6,015 | 6,026 | NO |
|---|
| Built 1980 to 1989 | 11,868 | 1,850 | 1,125 | 11,726 | 142 | YES |
|---|
| Built 1970 to 1979 | 12,318 | 1,507 | 916 | 4,112 | 8,206 | NO |
|---|
| Built 1960 to 1969 | 11,257 | 1,457 | 886 | 13,560 | -2,303 | NO |
|---|
| Built 1950 to 1959 | 14,239 | 1,990 | 1,210 | 16,403 | -2,164 | NO |
|---|
| Built 1940 to 1949 | 15,815 | 1,684 | 1,024 | 18,267 | -2,452 | NO |
|---|
| Built 1939 or earlier | 10,334 | 1,357 | 825 | 9,495 | 839 | YES |
|---|
| NA | | | | 6,662 | | |
|---|
5 Year
| Geography: | Arlington County, Virginia |
|---|
| Dataset: 2009-2013 5-year | B25034 YEAR STRUCTURE BUILT [Universe: Housing units] |
|---|
| Description of Variable | ACS Benchmark | Direct Estimate from Arlington County Real Estate |
|---|
| Estimate | 90%MOE | Estimate | Difference | Within 90%MOE? |
|---|
| Total | 106,740 | 191 | 100,233 | 6,507 | NO |
|---|
| Built 2010 or later | 1.18% | 0.21% | 5.06% | -3.88% | NO |
|---|
| Built 2000 to 2009 | 15.83% | 0.71% | 14.49% | 1.34% | NO |
|---|
| Built 1990 to 1999 | 9.15% | 0.68% | 8.73% | 0.43% | YES |
|---|
| Built 1980 to 1989 | 11.26% | 0.60% | 11.16% | 0.10% | YES |
|---|
| Built 1970 to 1979 | 10.67% | 0.72% | 6.48% | 4.19% | NO |
|---|
| Built 1960 to 1969 | 11.64% | 0.73% | 14.91% | -3.27% | NO |
|---|
| Built 1950 to 1959 | 15.71% | 0.78% | 15.62% | 0.09% | YES |
|---|
| Built 1940 to 1949 | 15.56% | 0.68% | 16.59% | -1.03% | NO |
|---|
| Built 1939 or earlier | 9.00% | 0.47% | 6.05% | 2.94% | NO |
|---|
1 Year
| Geography: | Arlington County, Virginia |
|---|
| Dataset: 2009 1-year | B25034 YEAR STRUCTURE BUILT [Universe: Housing units] |
|---|
| Description of Variable | ACS Benchmark | Direct Estimate from Arlington County Real Estate |
|---|
| Estimate | 90%MOE | Estimate | Difference | Within 90%MOE? |
|---|
| Total | 105,490 | 872 | 99,595 | 5,895 | NO |
|---|
| Built 2005 or later | 5.31% | 1.12% | 7.24% | -1.93% | NO |
|---|
| Built 2000 to 2004 | 8.82% | 1.66% | 5.94% | 2.88% | NO |
|---|
| Built 1990 to 1999 | 8.36% | 1.24% | 7.40% | 0.95% | YES |
|---|
| Built 1980 to 1989 | 11.66% | 1.79% | 11.95% | -0.29% | YES |
|---|
| Built 1970 to 1979 | 10.38% | 1.63% | 4.14% | 6.24% | NO |
|---|
| Built 1960 to 1969 | 11.79% | 1.46% | 16.06% | -4.27% | NO |
|---|
| Built 1950 to 1959 | 18.04% | 2.04% | 17.15% | 0.88% | YES |
|---|
| Built 1940 to 1949 | 17.51% | 2.00% | 20.52% | -3.01% | NO |
|---|
| Built 1939 or earlier | 8.14% | 1.14% | 9.60% | -1.46% | NO |
|---|
| NA | | | 1.39% | | |
|---|
| Geography: | Arlington County, Virginia |
|---|
| Dataset: 2010 1-year | B25034 YEAR STRUCTURE BUILT [Universe: Housing units] |
|---|
| Description of Variable | ACS Benchmark | Direct Estimate from Arlington County Real Estate |
|---|
| Estimate | 90%MOE | Estimate | Difference | Within 90%MOE? |
|---|
| Total | 105,490 | 619 | 101,025 | 4,465 | NO |
|---|
| Built 2005 or later | 8.00% | 1.33% | 8.30% | -0.30% | YES |
|---|
| Built 2000 to 2004 | 8.49% | 1.71% | 5.85% | 2.64% | NO |
|---|
| Built 1990 to 1999 | 8.04% | 1.25% | 1.36% | 6.68% | NO |
|---|
| Built 1980 to 1989 | 12.73% | 1.63% | 11.87% | 0.87% | YES |
|---|
| Built 1970 to 1979 | 9.18% | 1.54% | 4.08% | 5.10% | NO |
|---|
| Built 1960 to 1969 | 12.41% | 1.67% | 15.99% | -3.57% | NO |
|---|
| Built 1950 to 1959 | 17.07% | 2.10% | 16.89% | 0.19% | YES |
|---|
| Built 1940 to 1949 | 16.10% | 1.60% | 20.21% | -4.11% | NO |
|---|
| Built 1939 or earlier | 7.97% | 1.13% | 9.51% | -1.54% | NO |
|---|
| NA | | | 1.42% | | |
|---|
| Geography: | Arlington County, Virginia |
|---|
| Dataset: 2011 1-year | B25034 YEAR STRUCTURE BUILT [Universe: Housing units] |
|---|
| Description of Variable | ACS Benchmark | Direct Estimate from Arlington County Real Estate |
|---|
| Estimate | 90%MOE | Estimate | Difference | Within 90%MOE? |
|---|
| Total | 106,720 | 417 | 101,489 | 5,231 | NO |
|---|
| Built 2005 or later | 9.46% | 2.15% | 8.76% | 0.70% | YES |
|---|
| Built 2000 to 2004 | 9.59% | 2.06% | 5.80% | 3.79% | NO |
|---|
| Built 1990 to 1999 | 9.59% | 2.28% | 16.83% | -7.24% | NO |
|---|
| Built 1980 to 1989 | 10.23% | 2.35% | 15.93% | -5.71% | NO |
|---|
| Built 1970 to 1979 | 10.67% | 1.82% | 4.07% | 6.60% | NO |
|---|
| Built 1960 to 1969 | 11.85% | 2.70% | 11.73% | 0.12% | YES |
|---|
| Built 1950 to 1959 | 14.64% | 1.98% | 7.27% | 7.38% | NO |
|---|
| Built 1940 to 1949 | 14.38% | 1.72% | 14.35% | 0.03% | YES |
|---|
| Built 1939 or earlier | 9.59% | 1.36% | 0.21% | 9.38% | NO |
|---|
| NA | | | 0.79% | | |
|---|
| Geography: | Arlington County, Virginia |
|---|
| Dataset: 2012 1-year | B25034 YEAR STRUCTURE BUILT [Universe: Housing units] |
|---|
| Description of Variable | ACS Benchmark | Direct Estimate from Arlington County Real Estate |
|---|
| Estimate | 90%MOE | Estimate | Difference | Within 90%MOE? |
|---|
| Total | 107,734 | 537 | 101,731 | 6,003 | NO |
|---|
| Built 2010 or later | 1.49% | 0.42% | 0.72% | 0.77% | NO |
|---|
| Built 2000 to 2009 | 15.32% | 1.78% | 14.35% | 0.97% | YES |
|---|
| Built 1990 to 1999 | 9.13% | 1.29% | 7.25% | 1.88% | NO |
|---|
| Built 1980 to 1989 | 11.80% | 1.77% | 11.70% | 0.09% | YES |
|---|
| Built 1970 to 1979 | 10.78% | 1.50% | 4.06% | 6.72% | NO |
|---|
| Built 1960 to 1969 | 10.41% | 1.62% | 15.73% | -5.32% | NO |
|---|
| Built 1950 to 1959 | 15.28% | 1.55% | 16.74% | -1.46% | YES |
|---|
| Built 1940 to 1949 | 16.13% | 1.41% | 19.98% | -3.85% | NO |
|---|
| Built 1939 or earlier | 9.67% | 1.28% | 9.46% | 0.21% | YES |
|---|
| NA | | | 0.76% | | |
|---|
| Geography: | Arlington County, Virginia |
|---|
| Dataset: 2013 1-year | B25034 YEAR STRUCTURE BUILT [Universe: Housing units] |
|---|
| Description of Variable | ACS Benchmark | Direct Estimate from Arlington County Real Estate |
|---|
| Estimate | 90%MOE | Estimate | Difference | Within 90%MOE? |
|---|
| Total | 109,689 | 504 | 97,325 | 12,364 | NO |
|---|
| Built 2010 or later | 3.51% | 0.89% | 1.89% | 1.62% | NO |
|---|
| Built 2000 to 2009 | 16.38% | 1.73% | 16.39% | -0.01% | YES |
|---|
| Built 1990 to 1999 | 10.98% | 1.46% | 6.18% | 4.80% | NO |
|---|
| Built 1980 to 1989 | 10.82% | 1.69% | 12.05% | -1.23% | YES |
|---|
| Built 1970 to 1979 | 11.23% | 1.38% | 4.23% | 7.00% | NO |
|---|
| Built 1960 to 1969 | 10.26% | 1.33% | 13.93% | -3.67% | NO |
|---|
| Built 1950 to 1959 | 12.98% | 1.82% | 16.85% | -3.87% | NO |
|---|
| Built 1940 to 1949 | 14.42% | 1.54% | 18.77% | -4.35% | NO |
|---|
| Built 1939 or earlier | 9.42% | 1.24% | 9.76% | -0.33% | YES |
|---|
| NA | | | 6.42% | | |
|---|
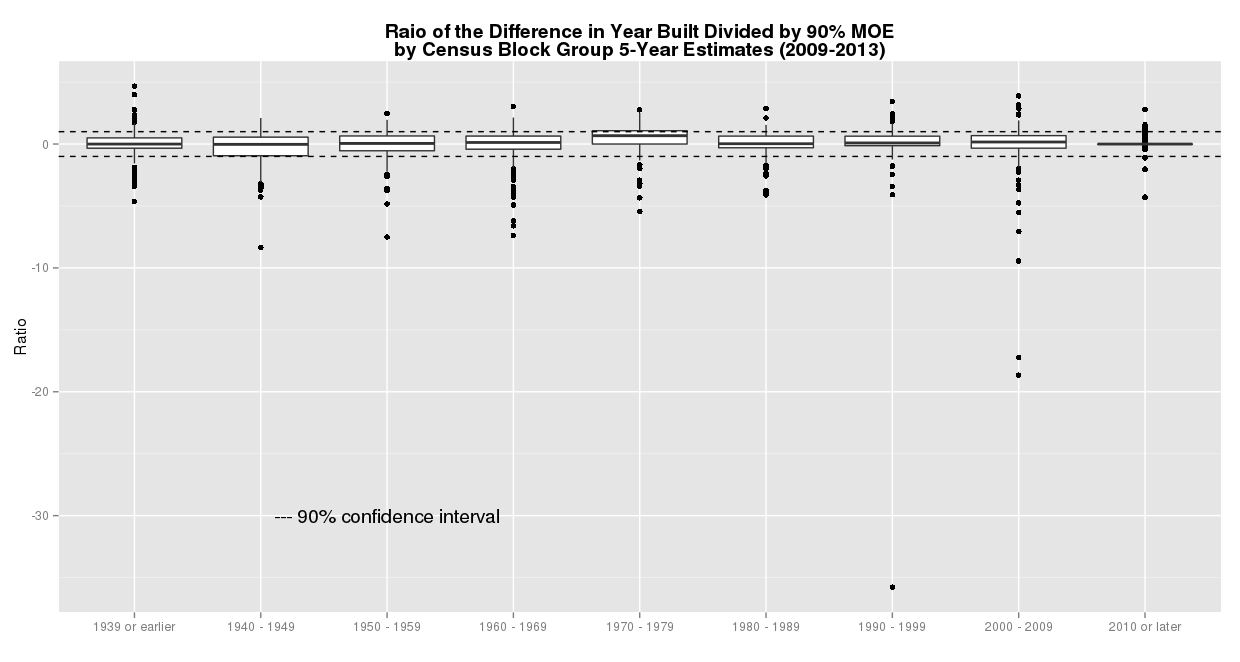
Unit of Observation: Tract (59)

Outliers
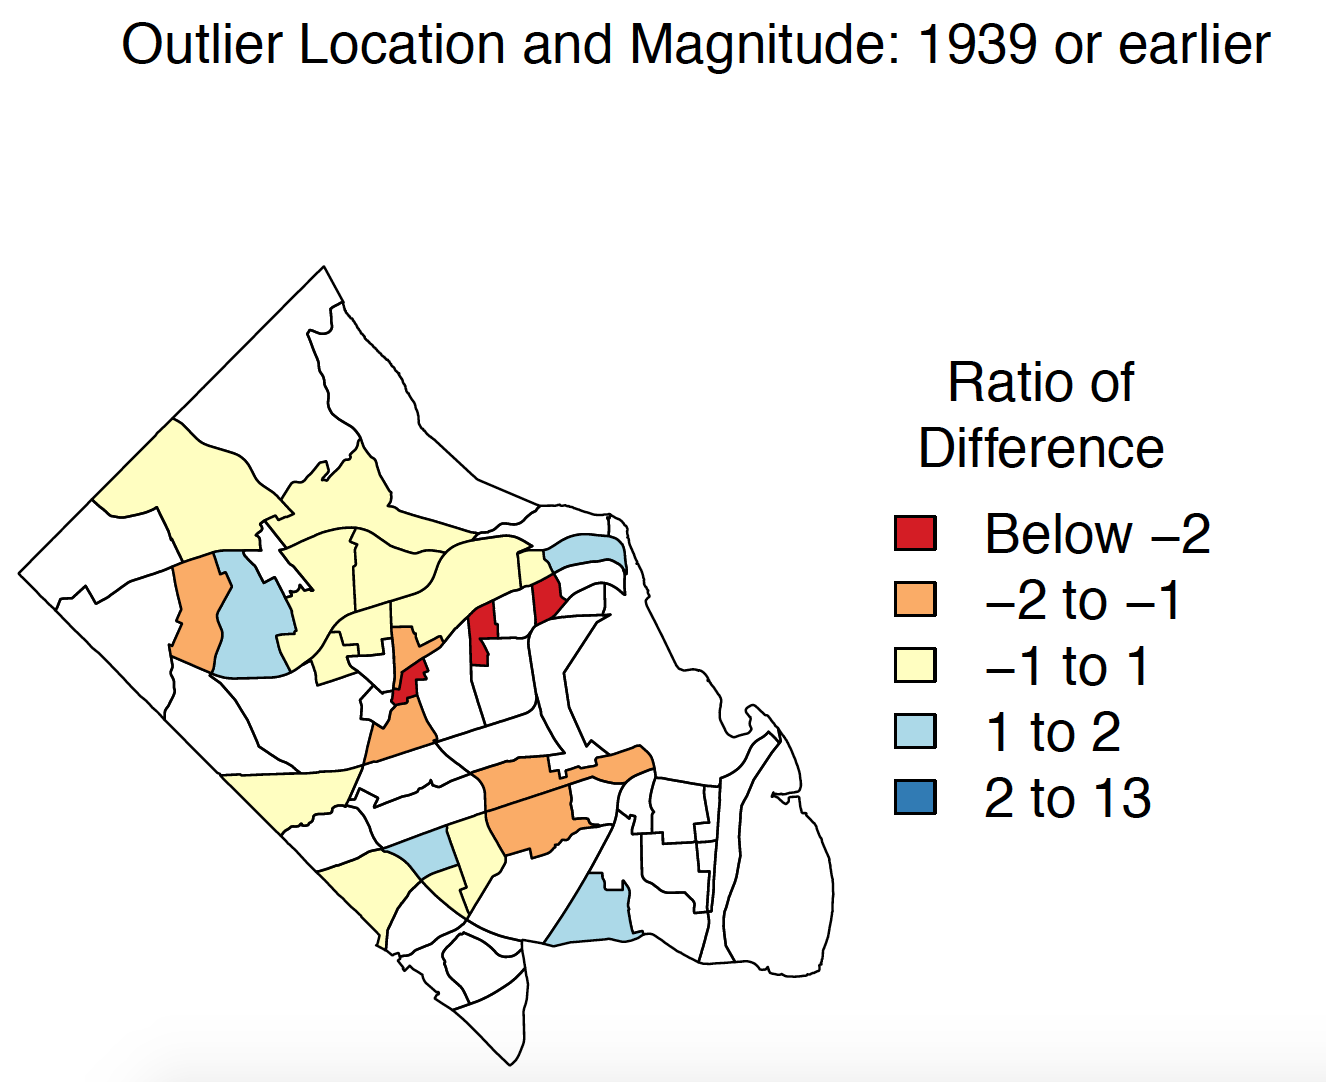
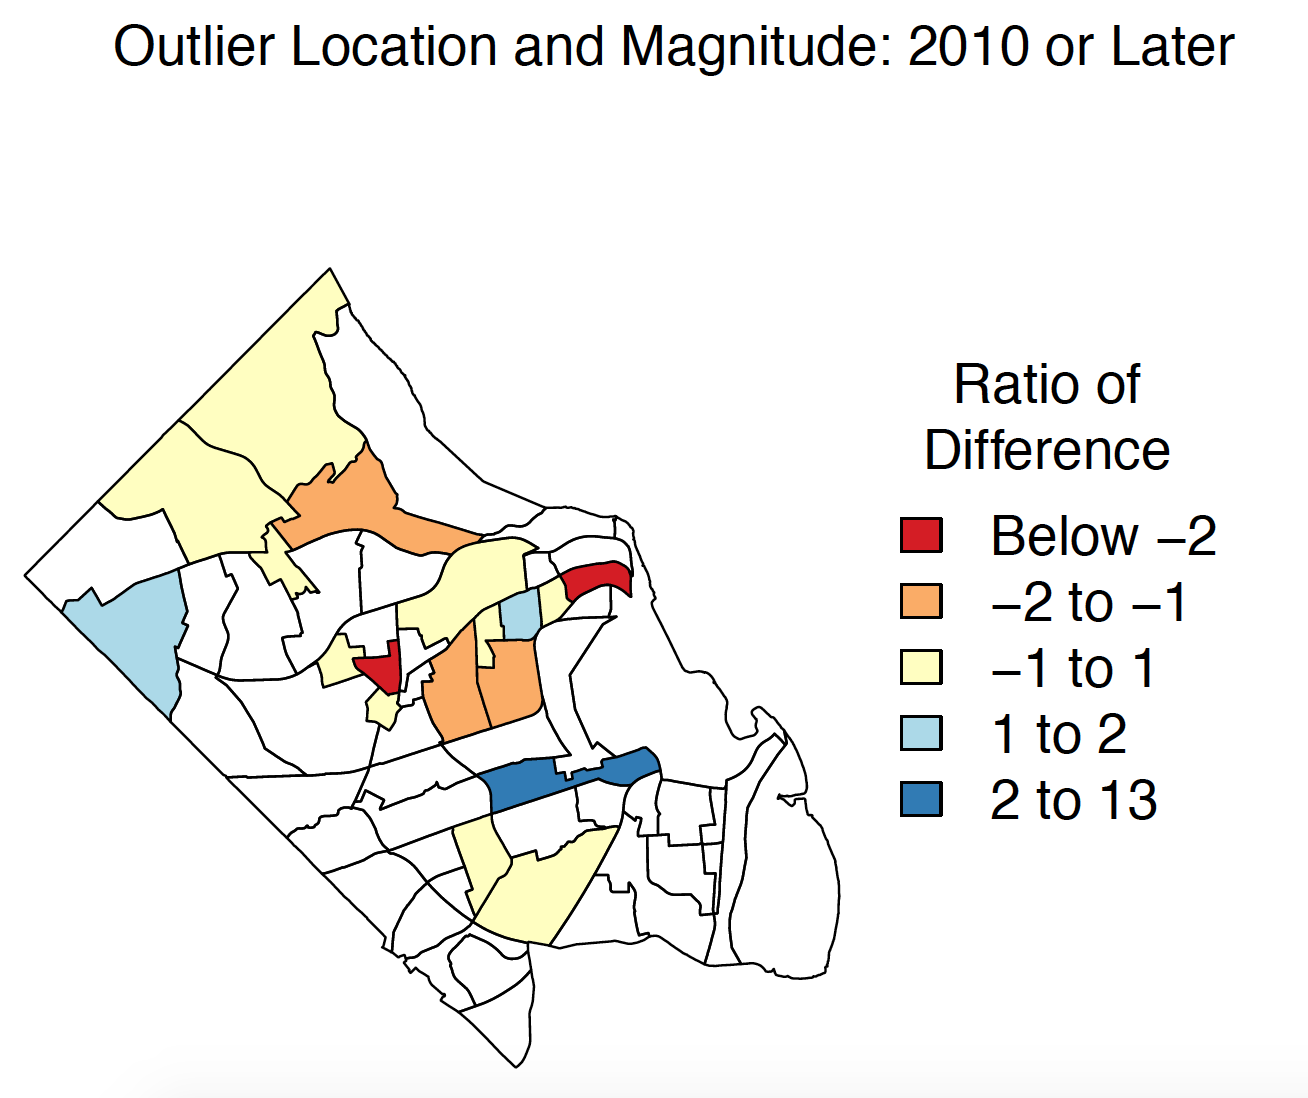
Unit of Observation: Block Group (181)