Notes:
- Bolded: ACS 90% MOE crosses 0 (no data still with MOE)
- Arlington County data is weighted by the number of units within the property.
- Not all properties have a units counts, which drives the number of housing units down (especially when the NA is for a multifamily).
- Number of unknown units count: 206 (2009), 233 (2010), 237 (2011), 248 (2012) and 463 (2013)
- All prepared Arlington County data are used in the tabulations. When calculating census tract and block group (bg) comparisons, only those data that are within a designated tract/bg are included. When geocoding addresses along the county boarder, rooftop coordinates can occur outside the county. When merging tract to coordinates, these properties would not receive a tract/BG ID number
County
5 year
| Geography: | Arlington County, Virginia | |||||
|---|---|---|---|---|---|---|
| Dataset: 2009-2013 5-year | B25001. Housing Units [Universe: Housing Units] | |||||
| Description of Variable | ACS Benchmark | Direct Estimate from Arlington County Real Estate | ||||
| Estimate | 90%MOE | SE | Estimate | Difference | Within 90%MOE? | |
| Total | 106,740 | 191 | 116 | 102,331 | 4,409 | NO |
| Geography: | Arlington County, Virginia | |||||
|---|---|---|---|---|---|---|
| Dataset: 2009 1-year | B25001. Housing Units [Universe: Housing Units] | |||||
| Description of Variable | ACS Benchmark | Direct Estimate from Arlington County Real Estate | ||||
| Estimate | 90%MOE | SE | Estimate | Difference | Within 90%MOE? | |
| Total | 103,813 | 872 | 530 | 100,991 | 2,822 | NO |
| Geography: | Arlington County, Virginia | |||||
|---|---|---|---|---|---|---|
| Dataset: 2010 1-year | B25001. Housing Units [Universe: Housing Units] | |||||
| Description of Variable | ACS Benchmark | Direct Estimate from Arlington County Real Estate | ||||
| Estimate | 90%MOE | SE | Estimate | Difference | Within 90%MOE? | |
| Total | 105,490 | 619 | 376 | 101,867 | 3,623 | NO |
| Geography: | Arlington County, Virginia | |||||
|---|---|---|---|---|---|---|
| Dataset: 2011 1-year | B25001. Housing Units [Universe: Housing Units] | |||||
| Description of Variable | ACS Benchmark | Direct Estimate from Arlington County Real Estate | ||||
| Estimate | 90%MOE | SE | Estimate | Difference | Within 90%MOE? | |
| Total | 106,720 | 417 | 253 | 102,299 | 4,421 | NO |
| Geography: | Arlington County, Virginia | |||||
|---|---|---|---|---|---|---|
| Dataset: 2012 1-year | B25001. Housing Units [Universe: Housing Units] | |||||
| Description of Variable | ACS Benchmark | Direct Estimate from Arlington County Real Estate | ||||
| Estimate | 90%MOE | SE | Estimate | Difference | Within 90%MOE? | |
| Total | 107,734 | 537 | 326 | 102,511 | 5,223 | NO |
| Geography: | Arlington County, Virginia | |||||
|---|---|---|---|---|---|---|
| Dataset: 2013 1-year | B25001. Housing Units [Universe: Housing Units] | |||||
| Description of Variable | ACS Benchmark | Direct Estimate from Arlington County Real Estate | ||||
| Estimate | 90%MOE | SE | Estimate | Difference | Within 90%MOE? | |
| Total | 109,689 | 504 | 306 | 103,987 | 5,702 | NO |
Census Tract
Unit of Observation: Tract (59)
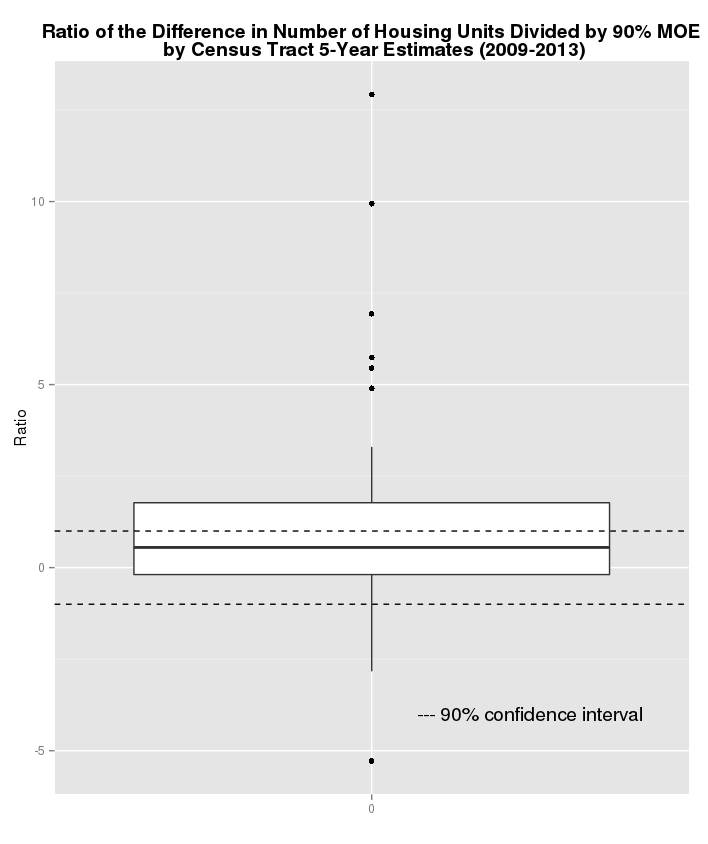
Descriptive Stats of Ratio
| 25% | Median | 75% | |
|---|---|---|---|
| Total: | -0.04 | 0.66 | 1.87 |
Outliers
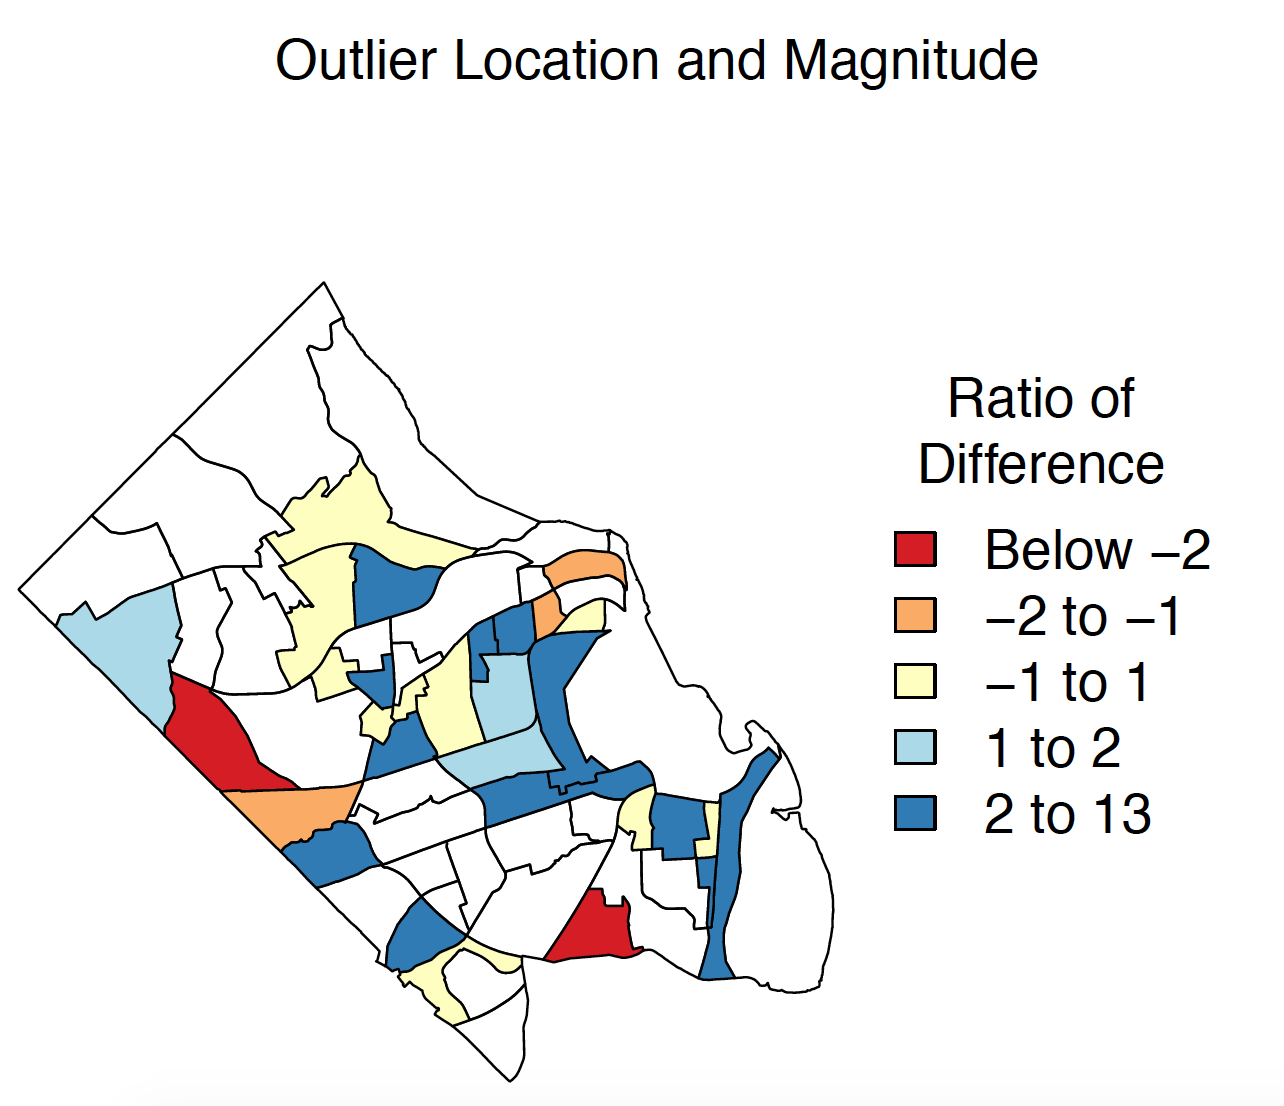
Comparison of Misses to Growth
Hypothesis: ACS estimates differ from Arlington County Data
Check to see if misses (ratio score <1 or >1) are occurring in areas with large net unit change.
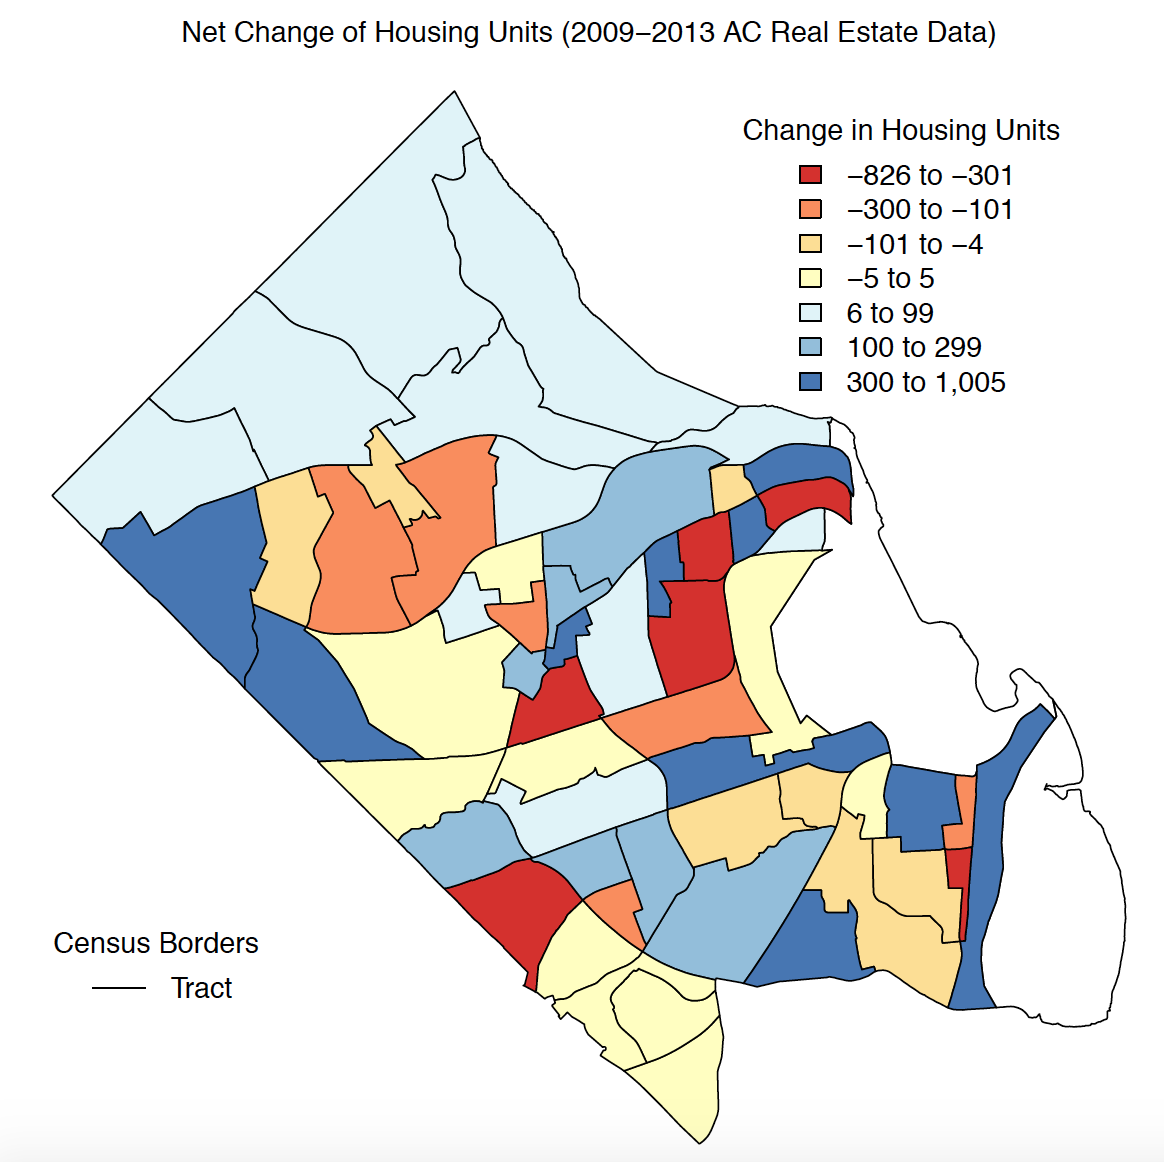
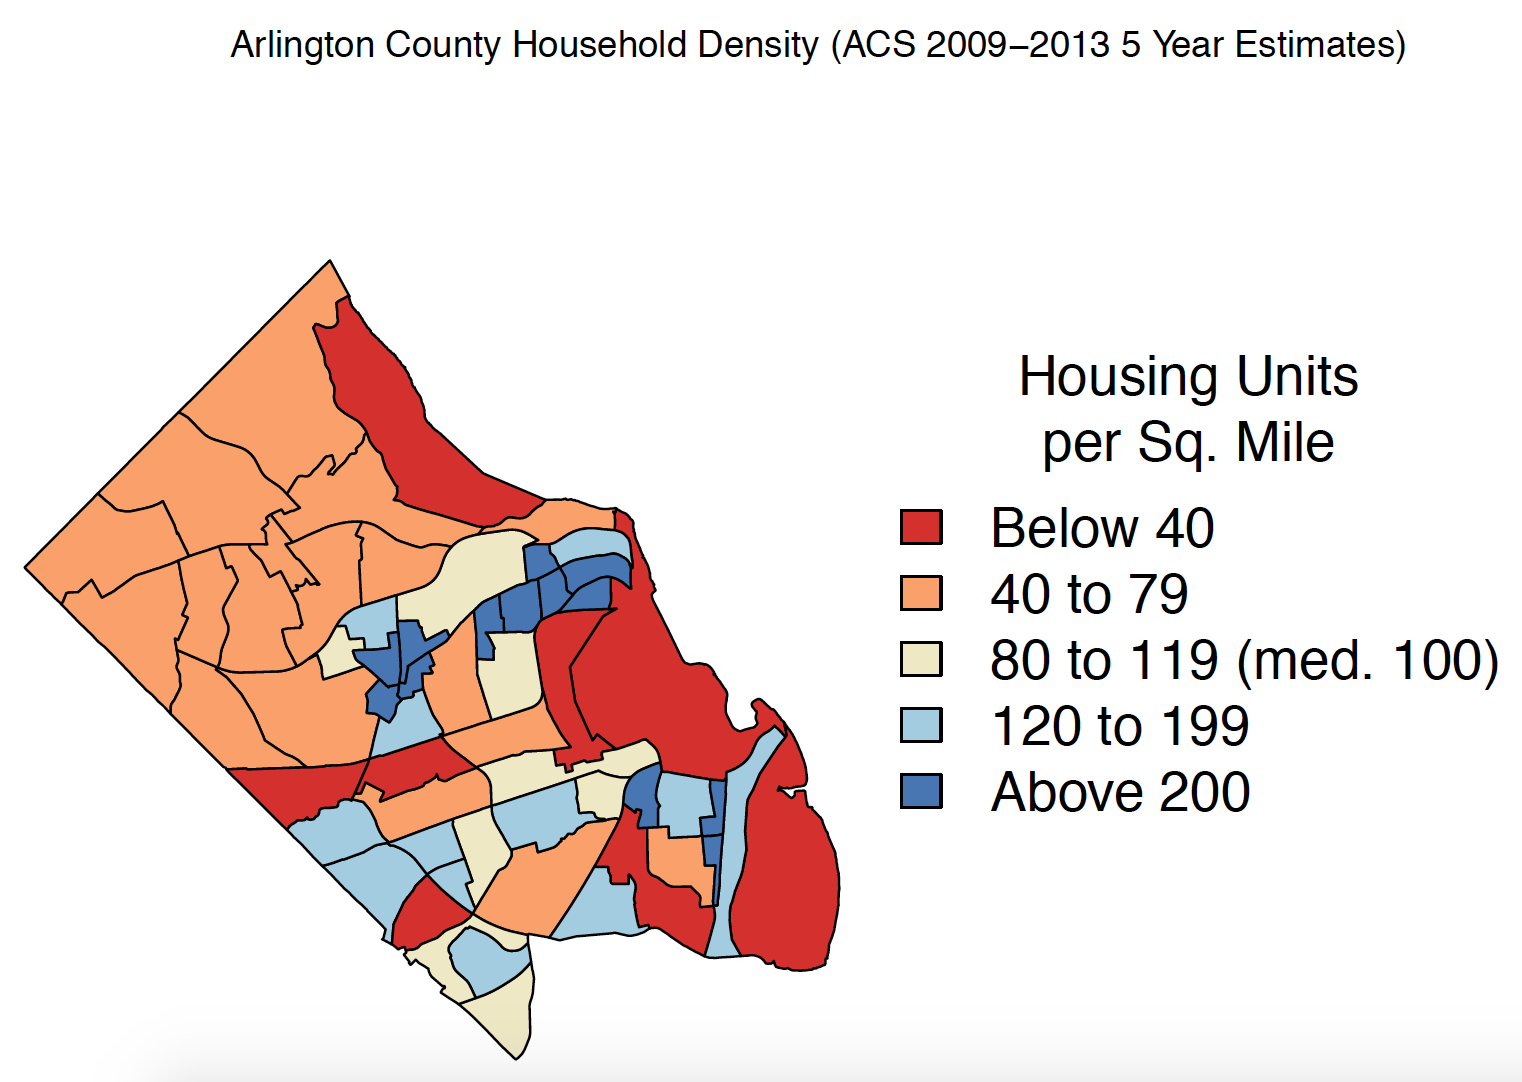
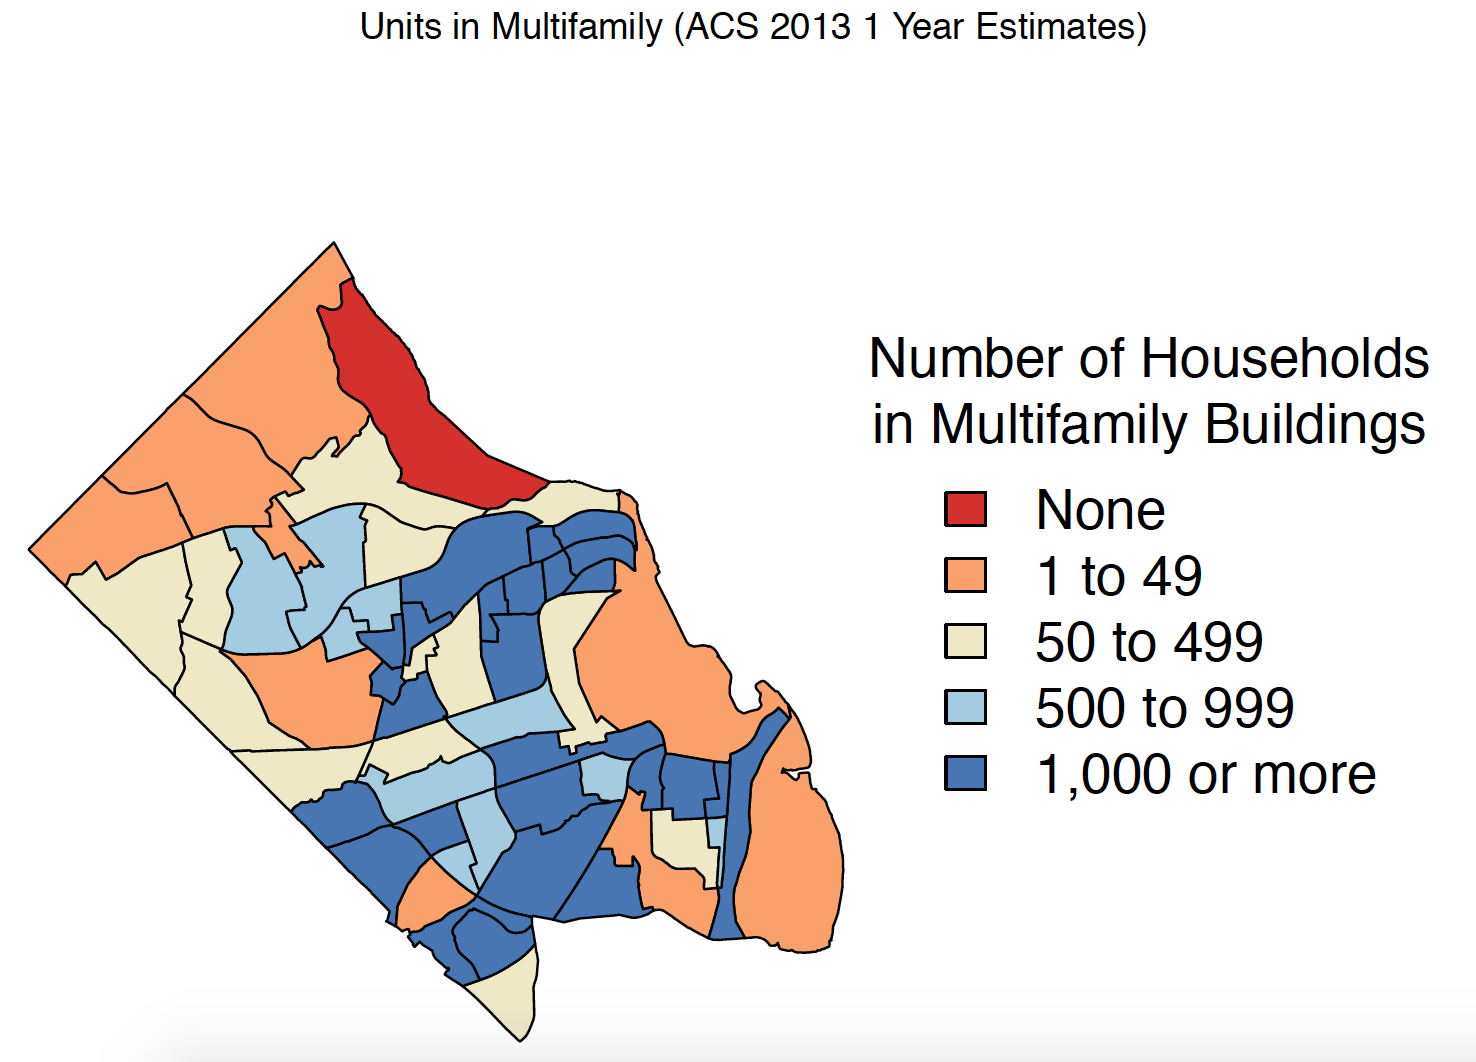
Comparison of Misses to Housing Density
Hypothesis: Arlington County data is under estimating multi-family buildings due to bad/missing units counts for multi-family buildings.
Check to see if underestimations (ratio score >1) are occurring in areas with multifamily/high housing units density. (Blue areas of both maps should then overlap.)
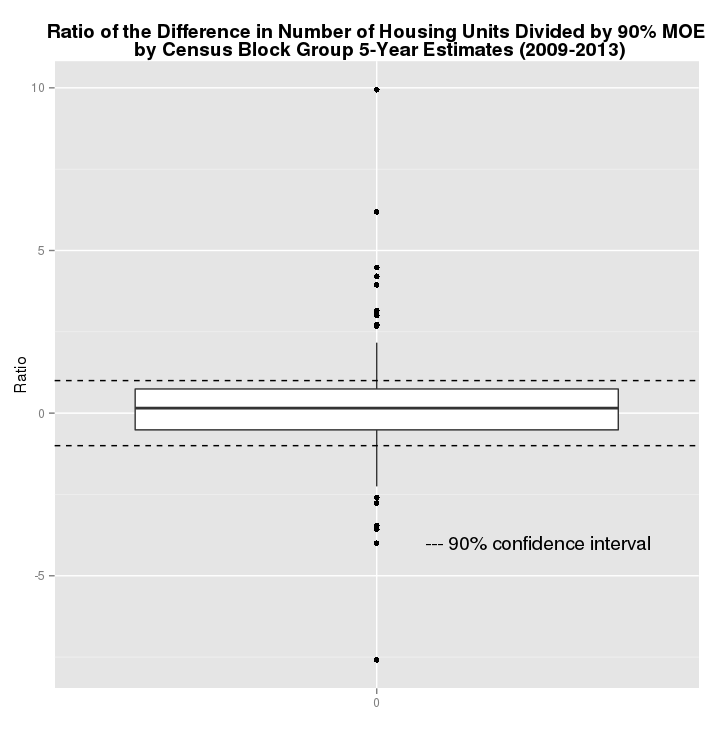
Census Block Group
Unit of Observation: Block Group (181)